-
Notifications
You must be signed in to change notification settings - Fork 2
Kafka Machine Learning
Kai Waehner discusses Kafka ML scenarios in his blog entry Streaming Machine Learning with Kafka-native Model Deployment
He starts with the remote procedure call approach similar to the InvokeWatsonStudio function in Monitor.
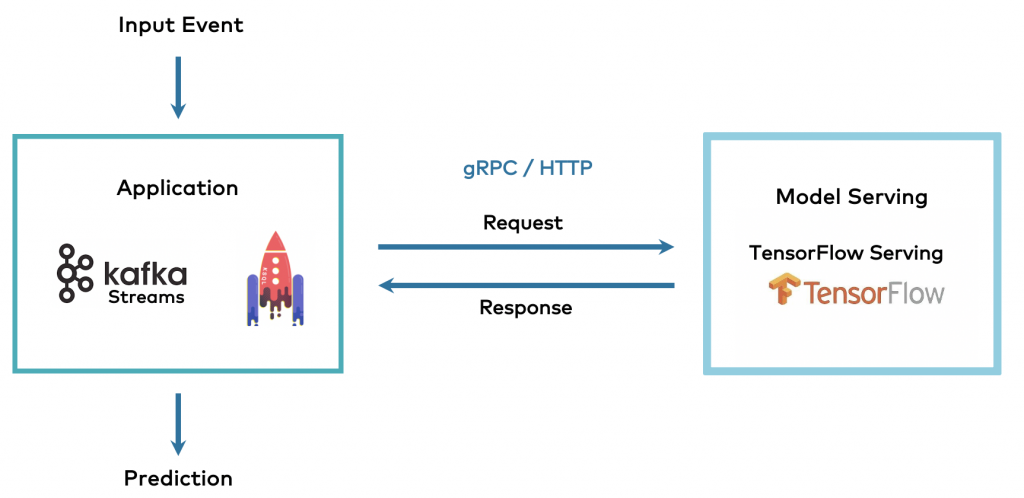
This and the following 2 figures are copyrighted by Kai Waehner
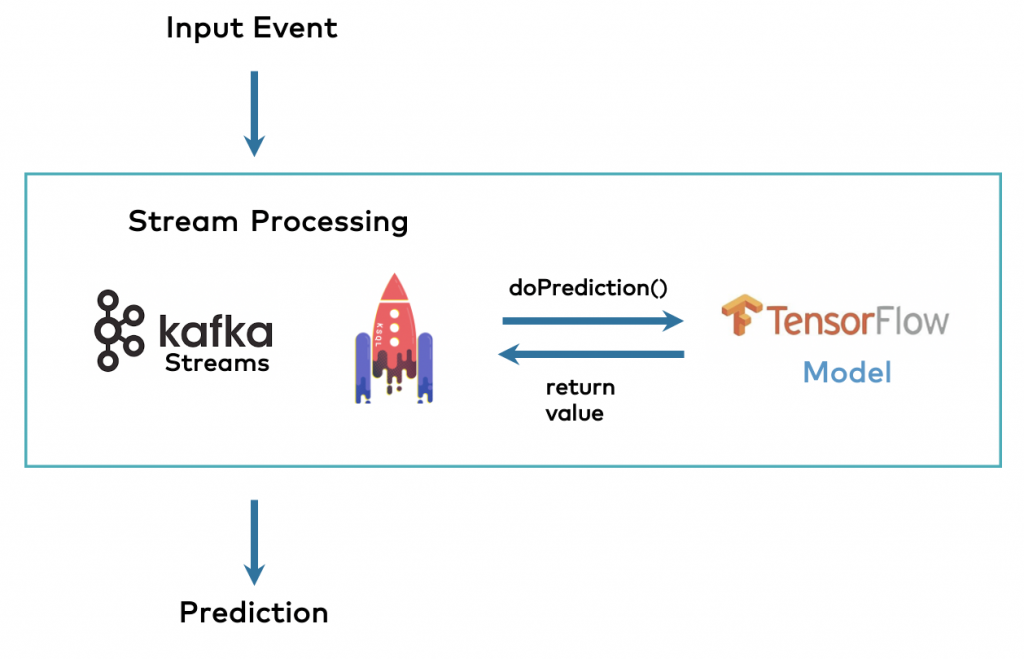
proceeds to the embedded model, i.e. the model exists as binary module to be instantiated prior to prediction. This is very similar to Monitor regressors, like GBMRegressor: the model exists as BLOB in the database and is instantiated and evaluated on request.
Finally he proposes the synthesis of both approaches: model server and application use Kafka topics to communicate.
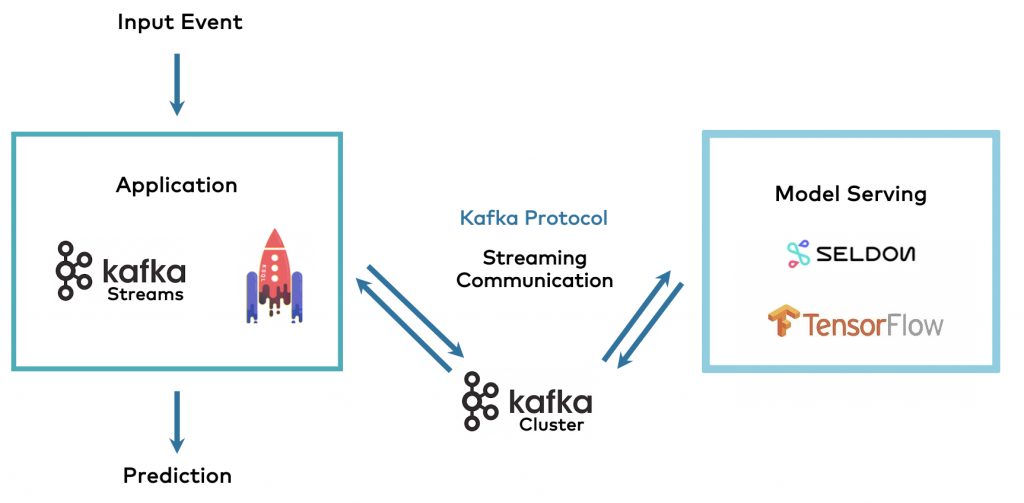
Unsupervised, untrainable models like K-Means anomaly scoring are likely implemented "in line", i.e. as Kafka function.
Make sure you have microk8s installed and the following add-ons enabled: (From the output of microk8s status)
microk8s is running
high-availability: no
  datastore master nodes: 127.0.0.1:19001
  datastore standby nodes: none
addons:
  enabled:
    dashboard            # The Kubernetes dashboard
    dns                  # CoreDNS
    ha-cluster           # Configure high availability on the current node
    helm                 # Helm 2 - the package manager for Kubernetes
    host-access          # Allow Pods connecting to Host services smoothly
    ingress              # Ingress controller for external access
    metrics-server       # K8s Metrics Server for API access to service metrics
    registry             # Private image registry exposed on localhost:32000
    storage              # Storage class; allocates storage from host directory
  disabled:
...
I installed Strimzi, Kafka on SteroidsKubernetes, on microk8s following the instructions laid out in Strimzi's quickstart guide. This worked without any issues - wow !
The installation creates stateful sets for Kafka and Zookeeper, along with two Operators for strimzi and the entity. For my single node microk8s installation this means Kafka comes up with two pod for Kafka and Zookeeper, enough to get the ball rolling.
Now make sure we can reach the Kafka broker from our host.
Caveat: All IP addresses are just examples from my installation.
- Assign a cluster IP to the broker (you don't need that if you call Kafka from another pod)
Save the broker service config in broker.yaml with
microk8s kubectl -n kafka get svc my-cluster-kafka-brokers -o yaml > broker.yaml
Edit this file so that an external cluster IP is assigned - following this context snippet example:
  publishNotReadyAddresses: true
  selector:
    strimzi.io/cluster: my-cluster
    strimzi.io/kind: Kafka
    strimzi.io/name: my-cluster-kafka
  clusterIP: 10.152.183.176
  clusterIPs:
    - 10.152.183.176
  type: ClusterIP
  sessionAffinity: None
- Delete the broker service with
microk8s kubectl -n kafka delete svc my-cluster-kafka-brokers
and recreate it with
microk8s kubectl -n kafka -f apply <your file>
- Finally add the line
10.152.183.176 my-cluster-kafka-0.my-cluster-kafka-brokers.kafka.svc
to the /etc/hosts file on your workstation.
Installing faust requires a fast persistency layer, like rocksdb. Since you need python bindings just follow the instructions in rocksdb guide and install librocksdb-dev. On Ubuntu this amounts to sudo apt install librocksdb-dev
And* this fails with
    rocksdb/_rocksdb.cpp:54079:22: warning: ‘void PyEval_InitThreads()’ is deprecated [-Wdeprecated-declarations]
    54079 |   PyEval_InitThreads();
          |                      ^
maybe because I'm penalized for using python 3.9.
Fortunately pip3 install faust[redis] works flawlessly.
First pip install the names module, pip install names.
Copy the following code into a file called faust_test.py
import names
import faust

class Greeting(faust.Record):
    from_name: str
    to_name: str

app = faust.App('hello-app', broker='kafka://10.152.183.177:9092')  ### REPLACE with your Kafka cluster IP
topic = app.topic('my-topic', value_type=Greeting)

@app.agent(topic)
async def hello(greetings):
    async for greeting in greetings:
        print(f'Hello from {greeting.from_name} to {greeting.to_name}')

@app.timer(interval=1.0)
async def example_sender(app):
    name = names.get_full_name(gender='female')
    await hello.send(
        value=Greeting(from_name=name, to_name='you'),
    )
then run
faust -A faust_test worker -l info
Starting with the medium article Basic stream processing using Kafka and Faust
The scenario is made of a kafka producer sending JSON encoded messages like {hitCount: hits=93, timestamp=1632411178.8660731, userId='16'}
with random "hit" number between 10 and 99 and a random user id between 15 and 20. The Kafka streaming application will receive these JSON documents, i.e hits per userId, fromc its input topic hit_count, will cumulate hits per userid and send the cumulated sum to its output topic count_topic.
The streaming application will then receive the cumulated data from count_topic and display it on the console.
Both components are implemented as separate asynchronous functions running in different thread.
Here the source (author: Abhishek Bose, https://github.com/AbhishekBose), included for better readability:
import faust


app = faust.App('hit_counter',broker="kafka://10.152.183.177:9092")

class hitCount(faust.Record,validation=True):
    hits: int
    timestamp: float
    userId: str


hit_topic = app.topic("hit_count",value_type=hitCount)
count_topic = app.topic('count_topic', internal=True, partitions=1, value_type=hitCount)

hits_table = app.Table('hitCount', default=int)
count_table = app.Table("major-count",key_type=str,value_type=int,partitions=1,default=int)

# first thread: receive hit count, cumulate and send it to output topic every 20th time.
@app.agent(hit_topic)
async def count_hits(counts):
    async for count in counts:
        print(f"Data received is {count}")
        if count.hits > 20:
            await count_topic.send(value=count)


# second thread: receive and display cumulated hits per userid
@app.agent(count_topic)
async def increment_count(counts):
    async for count in counts:
        print(f"Count in internal topic is {count}")
        count_table[str(count.userId)]+=1
        print(f'{str(count.userId)} has now been seen {count_table[str(count.userId)]} times')
The streaming application is started with faust -A hit_counter worker --web-port 6067 -l info. If stopped and restarted it repopulates the table from the Kafka changelog.
We could extend this approach to implement per asset windowing, then send the "windowed" timeseries data to the analytics function.
Same hit counter as before
import faust
import json
from typing import Set
from faust.types import AppT, TP

import numpy as np
import scipy as sp
from scipy import stats


app = faust.App('hit_counter',broker="kafka://10.152.183.177:9092")


class hitCount(faust.Record,validation=True):
    hits: int
    maxval: float
    timestamp: float
    userId: str


hit_topic = app.topic("hit_count", partitions=8, value_type=hitCount)
count_topic = app.topic('count_topic', internal=True, partitions=8, value_type=hitCount)

hits_table = app.Table('hitCount', partitions=8, key_type=str,value_type=str,default=str)
count_table = app.Table("major-count",key_type=str,value_type=float,partitions=1,default=float)

@app.on_configured.connect
def configure(app, conf, **kwargs):
    #conf.broker = os.environ.get('FAUST_BROKER')
    #conf.store = os.environ.get('STORE_URL')
    print(f'App {app} has been configured.')
    #print(f'Conf {conf}')

#@app.on_after_configured.connect
#def after_configuration(app, **kwargs):
#    print(f'App {app} has been configured.')


@app.agent(hit_topic)
async def count_hits(hits):
    async for hit in hits:
        print(f"Data received is {hit}")

        # get old value from table
        descriptor = None
        try:
            descriptor = json.loads(hits_table[str(hit.userId)])
        except Exception:
            descriptor = {}
            descriptor[hit.userId] = []

        # append new value
        descriptor[hit.userId].append(hit.hits)
        print (descriptor[hit.userId])
        if len(descriptor[hit.userId]) > 20:
            a = np.amax(np.abs(sp.stats.zscore(descriptor[hit.userId])))
            hit.maxval = max(hit.maxval, a)
            print('Send ', hit.maxval)
            await count_topic.send(value=hit)
            descriptor[hit.userId] = []
        hits_table[str(hit.userId)] = json.dumps(descriptor)


@app.agent(count_topic)
async def increment_count(counts):
    print ('Received ', counts)
    async for count in counts:
        print(f"Count in internal topic is {count}")
        count_table[str(count.userId)]+=1
        print(f'{str(count.userId)} has now been seen {count_table[str(count.userId)]} times')
but this time we collect the data from the hit-count topic in a Kafka changelog backed table until we have 20 elements, then we compute the z-score (normalized standard deviation) and send the max score to the next topic. The idea is to find limitations with regard to typical analytics python packages.
Furthermore we test basic fault tolerance.
Running the example immediately crashes because the changelog topics (for "hit" and "count") have 8 partitions while the I/O topics have just one. So I started to look for a Kafka UI to manage topics - see the appendix for more.
I deleted all topics related to the fault application and recreated them on 8 partitions manually.
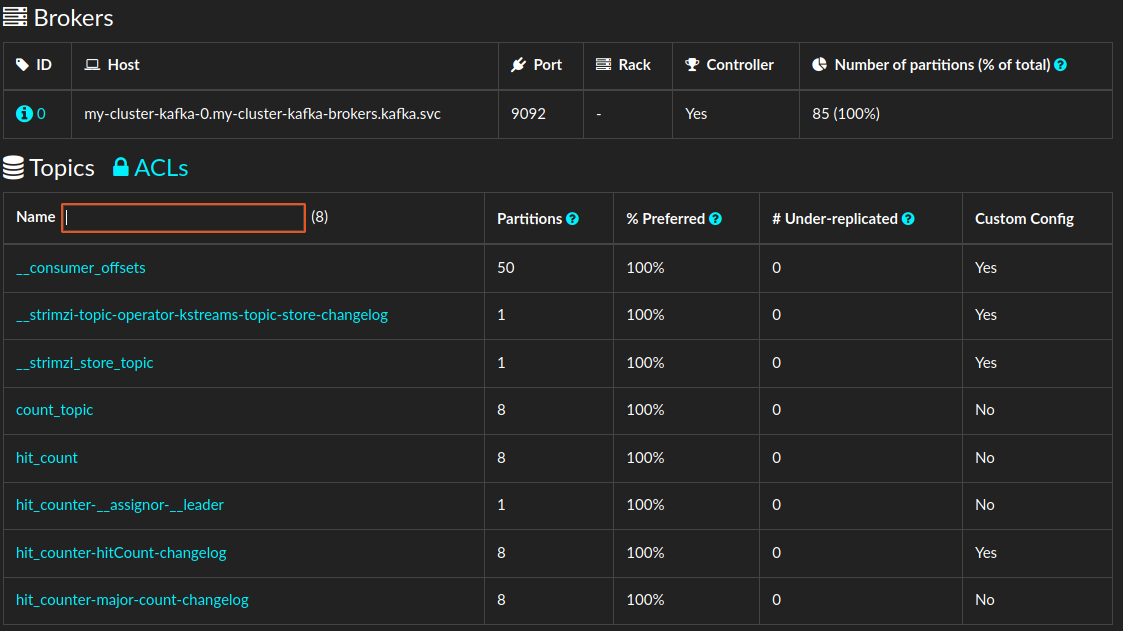
Afterwards starting the application worked fine.
Sending data and interrupting the application looks as shown here
[2021-09-24 18:00:09,060] [776868] [INFO] [^---Recovery]: Seek stream partitions to committed offsets.
[2021-09-24 18:00:09,072] [776868] [INFO] [^---Recovery]: Worker ready
[2021-09-24 18:00:09,072] [776868] [INFO] [^Worker]: Ready
[2021-09-24 18:00:12,994] [776868] [WARNING] Data received is <hitCount: hits=36, maxval=0.0, timestamp=1632499212.9865913, userId='15'>
[2021-09-24 18:00:12,994] [776868] [WARNING] {"15": []}
[2021-09-24 18:00:12,995] [776868] [WARNING] [36]
[2021-09-24 18:00:41,059] [776868] [WARNING] Data received is <hitCount: hits=11, maxval=0.0, timestamp=1632499241.0512257, userId='15'>
[2021-09-24 18:00:41,059] [776868] [WARNING] {"15": [36]}
[2021-09-24 18:00:41,059] [776868] [WARNING] [36, 11]
^C-INT- -INT- -INT- -INT- -INT- -INT-
[2021-09-24 18:00:53,681] [776868] [INFO] [^Worker]: Signal received: Signals.SIGINT (2)
[2021-09-24 18:00:53,682] [776868] [INFO] [^Worker]: Stopping...
[2021-09-24 18:00:53,683] [776868] [INFO] [^-App]: Stopping...
[2021-09-24 18:00:53,684] [776868] [INFO] [^---Fetcher]: Stopping...
Now the table has two elements, I'm restarting the Faust application and send it a single message to the input topic.
[2021-09-24 18:01:02,036] [779124] [INFO] [^---Recovery]: Worker ready
[2021-09-24 18:01:02,036] [779124] [INFO] [^Worker]: Ready
[2021-09-24 18:01:04,144] [779124] [WARNING] Data received is <hitCount: hits=12, maxval=0.0, timestamp=1632499264.1353946, userId='15'>
[2021-09-24 18:01:04,144] [779124] [WARNING] {"15": [36, 11]}
[2021-09-24 18:01:04,144] [779124] [WARNING] [36, 11, 12]
So there are now three elements in the array. I'm stopping it again and send it a single message while it's stopped. Then I restart it and it doesn't work.
Hmm, I see that there are a lot of messages in the 8 partitions of the changelog - and they are different per partition.
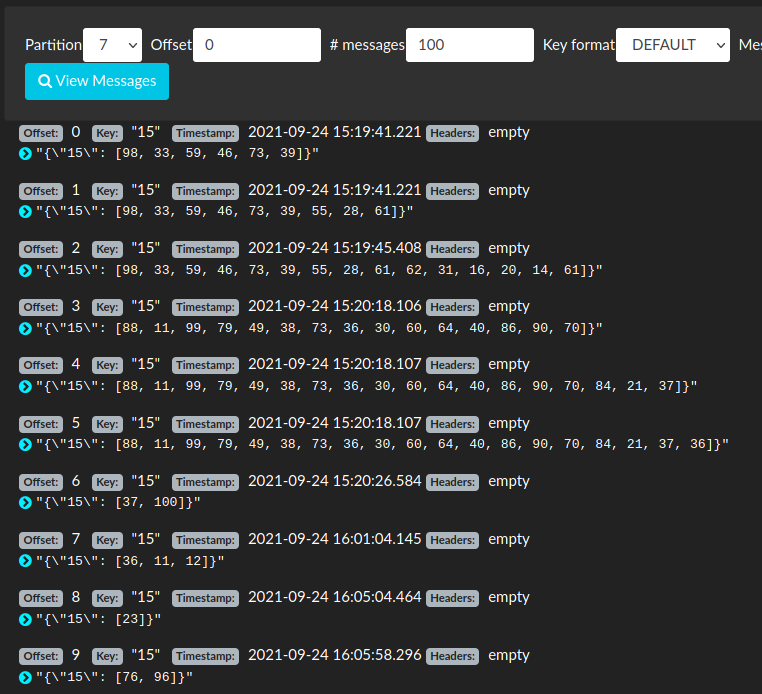
That might the reason fault tolerance fails for now.
I deleted all application topics and recreated them using a single partition only. And then it works. Phew !
I've extended the kafka message producer to send JSON encoded time series events like
{'temperature':24.42793794825654, 'maxval': 0.0, 'timestamp': '2021-09-27 14:20:26.560577', 'assetId'='15'}
the corresponding Faust app collects this data and keeps track of it in a Kafka topic backed table until we have at least 60 unprocessed messages for a given assetId. Then it transforms the list of events into a pandas dataframe and passes it to SpectralAnomalyScore.
I opted for KafDrop from Obsidian Dynamics.
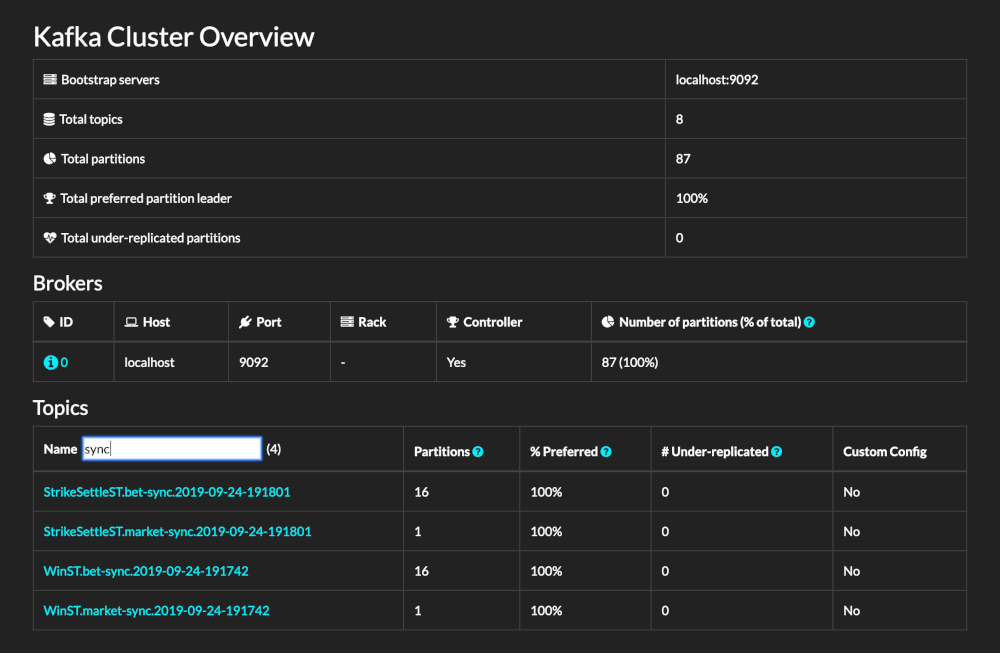
So I extracted the code, enabled helm3 on microk8s and installed the helm chart (make sure to set --namespace) with
git clone https://github.com/obsidiandynamics/kafdrop && cd kafdrop
microk8s enable helm3
microk8s helm3 upgrade -i kafdrop chart --namespace kafka --set image.tag=3.28.0-SNAPSHOT --set kafka.brokerConnect='10.152.183.177:9092'  --set server.servlet.contextPath="/"   --set cmdArgs="--message.format=AVRO --schemaregistry.connect=http://localhost:8080"
Unfortunately kafdrop is installed with a NodePort service, so I had to dump the service configuratio for kafdrop, delete it and recreate it as ClusterIP with kubectl apply.
The service YAML should look like the document below:
apiVersion: v1
items:
- apiVersion: v1
  kind: Service
  metadata:
    annotations:
      meta.helm.sh/release-name: kafdrop
      meta.helm.sh/release-namespace: kafka
    creationTimestamp: "2021-09-24T13:47:00Z"
    labels:
      app.kubernetes.io/instance: kafdrop
      app.kubernetes.io/managed-by: Helm
      app.kubernetes.io/name: kafdrop
      helm.sh/chart: kafdrop-0.1.0
    name: kafdrop
    namespace: kafka
    resourceVersion: "3574606"
    selfLink: /api/v1/namespaces/kafka/services/kafdrop
    uid: 7bc73f4a-38bb-460a-a111-3417eb3f1783
  spec:
    ports:
    - name: tcp-ctrlplane
      protocol: TCP
      port: 9000
      targetPort: 9000
    clusterIP: 10.152.183.184
    clusterIPs:
    - 10.152.183.184
    ipFamilies:
    - IPv4
    ipFamilyPolicy: SingleStack
    selector:
      app.kubernetes.io/instance: kafdrop
      app.kubernetes.io/name: kafdrop
    sessionAffinity: None
    type: ClusterIP
  status:
    loadBalancer: {}
kind: List
metadata:
  resourceVersion: ""
  selfLink: ""