Monitoring overview
- Prometheus: Collect and store metrics as time series data, execute monitoring checks and generate alerts
- Prometheus Alert Manager: Alert grouping, de-duplication and dispatch to alert receivers via slack, mail, pagerduty etc
- Grafana: Visualisation of time series metrics and dashboards
Try this simple walkthrough of prometheus setup to get hands on experience https://github.com/stefanprodan/dockprom
Look at Prometheus overview for high level view

Image: Edit Link
- The monitoring components listed above are deployed as a service in docker swarm.
- These services store data on disk. A Directory from swarm agent node is mounted as a volume inside container so that data is not lost when container restarts
- We have labelled the swarm agents to ensure these services always start on the same worker node
Node exporter is used for exposing host metrics like cpu, memory, disk, network etc
- Docker swarm agents: Node exporter is run on all worker nodes by deploying it as [global replication mode] service (https://docs.docker.com/engine/swarm/how-swarm-mode-works/services/#replicated-and-global-services) in docker swarm
- Other servers: Node exporter is installed as service in all the other servers using ansible
Cadvisor is used for exposing container metrics like cpu, memory, disk, network etc. Cadvisor exporter is run on all worker nodes by deploying it as [global replication mode] service (https://docs.docker.com/engine/swarm/how-swarm-mode-works/services/#replicated-and-global-services) in docker swarm
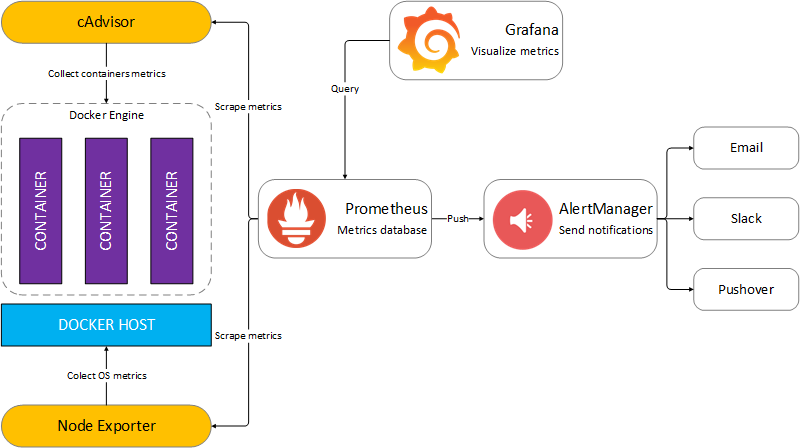
Image Source: https://stefanprodan.com/2016/a-monitoring-solution-for-docker-hosts-containers-and-containerized-services/
Prometheus community has lot of open source exporters for monitoring well known use cases. Sunbird has few homegrown exporters for few advanced cases
Each service deployed in docker swarm would have DNS entry for
-
<service-name>: This will resolve to single virtual IP of this service inside the network. This VIP is load balanced across all the containers running in swarm using IPVS -
tasks.<service-name>: This will resolve to multiple IP address each pointing to each container running for this service. If you are interested in collecting metrics from each containers instance, you can use prometheus dns_sd_config andtasks.<service-name>

Image Source: https://www.slideshare.net/Docker/monitoring-the-prometheus-way-julius-voltz-prometheus