Monitoring kong requests
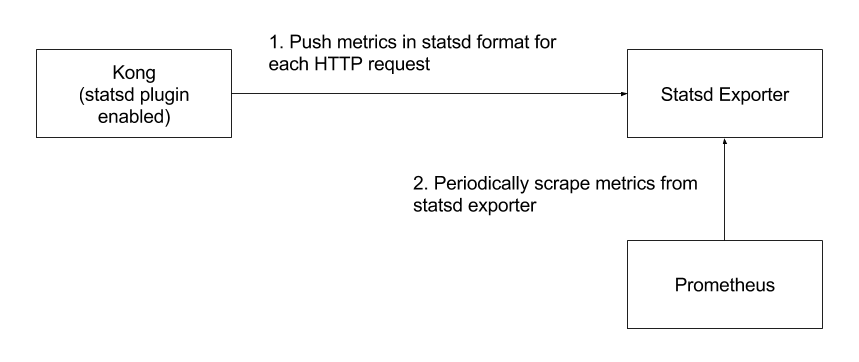
Image: Edit Link
Please read about statsd spec to understand the process
- APIs onboarded in is configured to send metrics in statsd format for each HTTP request. These metrics include
- response status code per API
- response time per API
- Others
kong.compositeSearch.request.status.200:1|c
kong.compositeSearch.latency:12|c
- Statsd exporter aggregates these per request metrics over configured time period like 10s and exposes this in
/metricsHTTP endpoint. It has a mapping which converts metrics from statsd format to prometheus metric format. Example
# Config
- match: kong.*.request.status.*
  labels:
    name: "kong_request_status_count"
    api: "$1"
    status_code: "$2"
- match: kong.*.latency
  labels:
    name: "kong_latency_time"
    api: "$1"
...
# Metrics
kong_request_status_count{api="compositeSearch",status_code="200"} 328
kong_latency_time{api="compositeSearch"} 38
...
- Prometheus periodically scrapes metrics from statsd exporter