-
Notifications
You must be signed in to change notification settings - Fork 1
Home
Note: PlotHiC is currently under quickl development. If you have any questions or new requirement, please Open Issues or provide us with your comments via the email below.
Author: Zijie Jiang
Email: [email protected]
- Dependency:
python>=3.10
# need python>=3.10
pip install plothic
# create plothic enviorment and install plothic
conda env create -n plothic -c bioconda plothic
- Input file:
genome.hic
This file is taken directly from 3d-dna, you need to select the final hic file (which has already been error adjusted and chromosome boundaries determined).
- Input file:
chr.tx(3 columns as follows, use "\t" as separator)
- This file is used for heatmap labeling. The first column is the name of the chromosome.
- The second column is the length of the chromosome (this length is the length of the hic file in Juicebox and can be manually determined from Juicebox).
- The third column is the order in which the chromosomes are placed, which is used to customize the arrangement of chromosomes (for example, from max to min).
Note: the length is in .hic file, not true base length (example as below).
# name length index
Chr1	24800000	5
Chr2	44380000	4
Chr3	63338000	3
Chr4	81187000	2
Chr5 97650000 1- Examples
- default
# Default order (left)
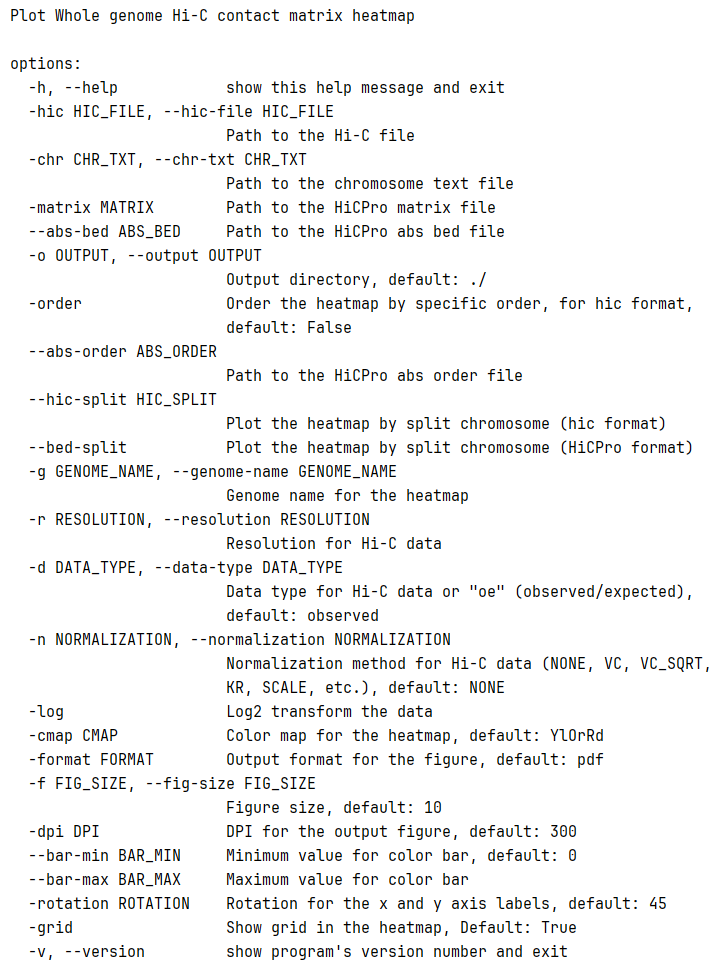
plothic -hic genome.hic -chr chr.txt -r 100000

# -hic > .hic file
# -chr > chromosome length (in .hic file)
# -r > resolution to visualization
- Specific order
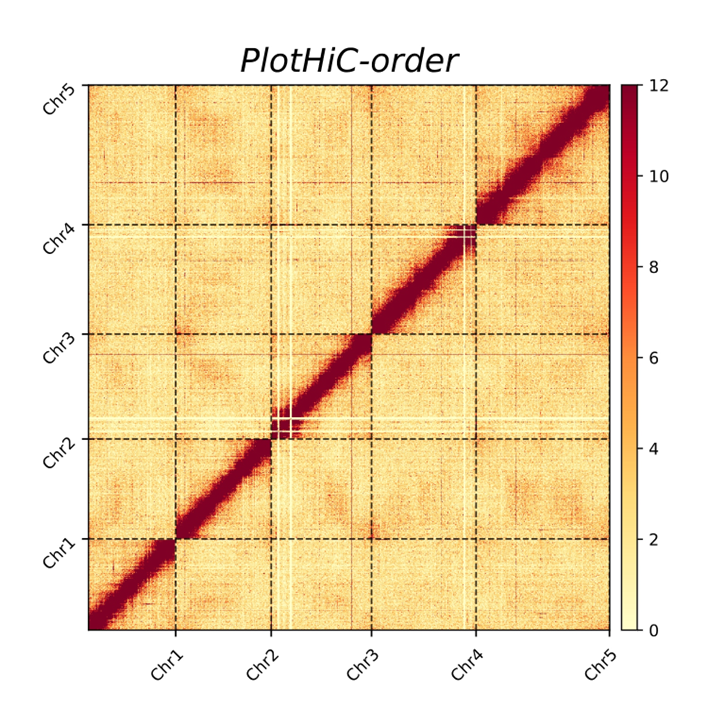
plothic -hic genome.hic -chr chr.txt -r 100000 --order

# --order > Sort by the order in chr.txt(index)
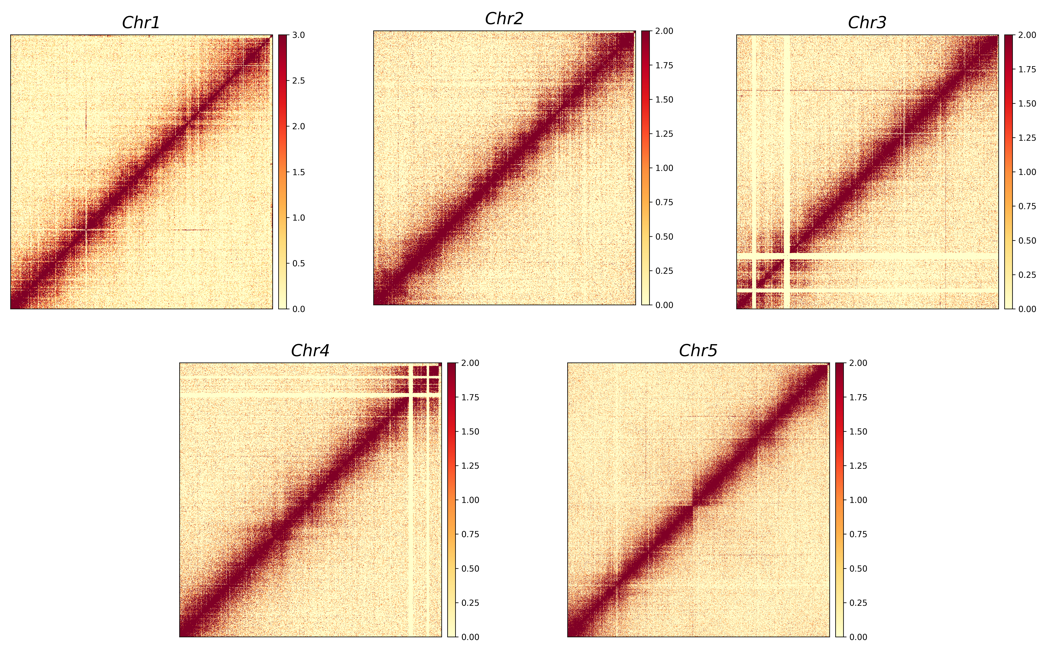
- split chromosomes
plothic -hic genome.hic -chr chr.txt -r 100000 --hic-split split.txt

# --hic-split > split chromosome visualization (format as below)
- split.txt (loci in hic file)
# name start end
Chr5 0  25000000
Chr4 25000000   44600000
Chr3 44600000   63400000
Chr2 63400000   81300000
Chr1 81300000 97600000- Input file:
genome.matrix - Input file:
genome_abs.bed
Both files are output from HiCPro. You can select a specific resolution based on your needs.
- Input file (optional):
order.txt, the content and format as follows:
# chr_name order
NC_003070.9	1
NC_003071.7	4
NC_003074.8	3
NC_003075.7	5
NC_003076.8 2- Examples
- default
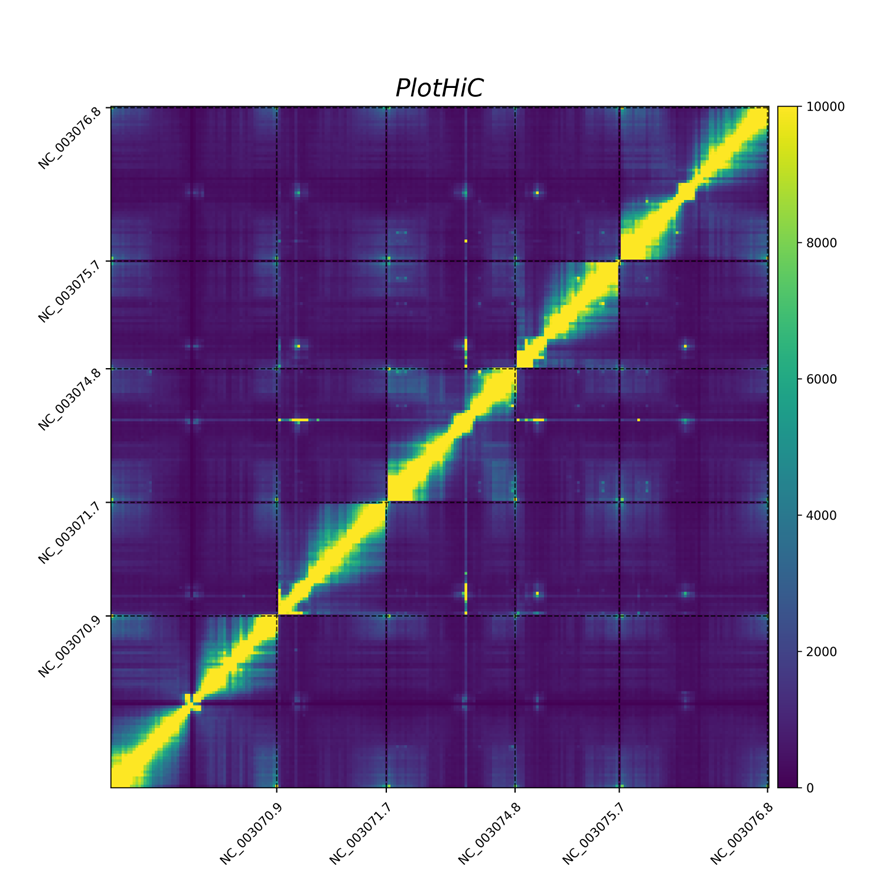
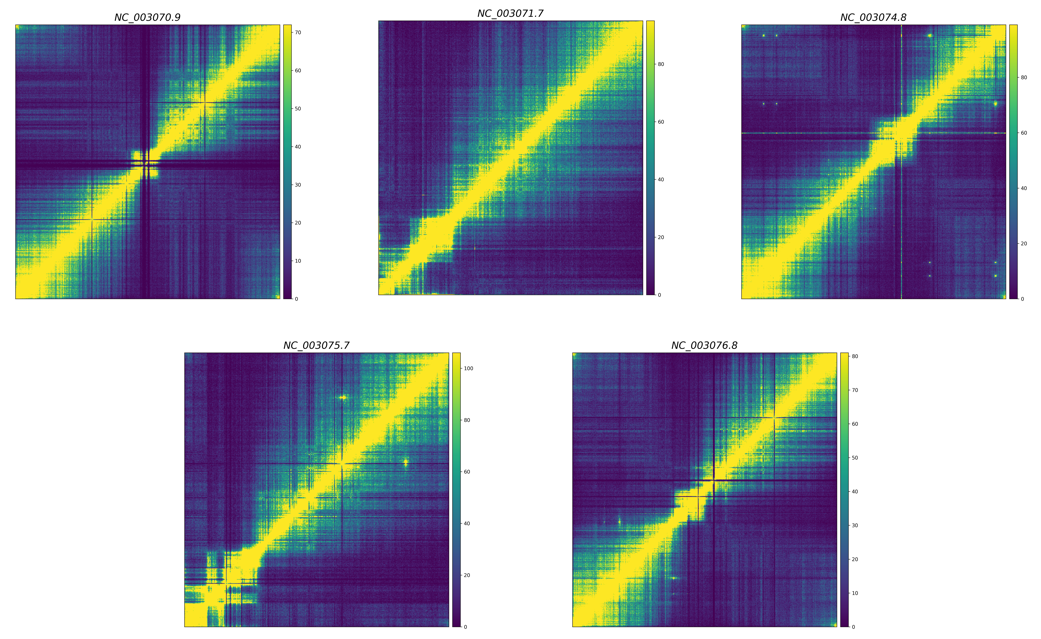
plothic -matrix sample_500000.matrix --abs-bed sample_500000_abs.bed -format png -cmap viridis --bar-max 10000 -g PlotHiC

# -matrix > matrix file
# --abs-bed > abs bed file
# -format > result format
# -cmap > viridis color
# --bar-max > max contact to show
# -g > Genome name to show top
- Specific order
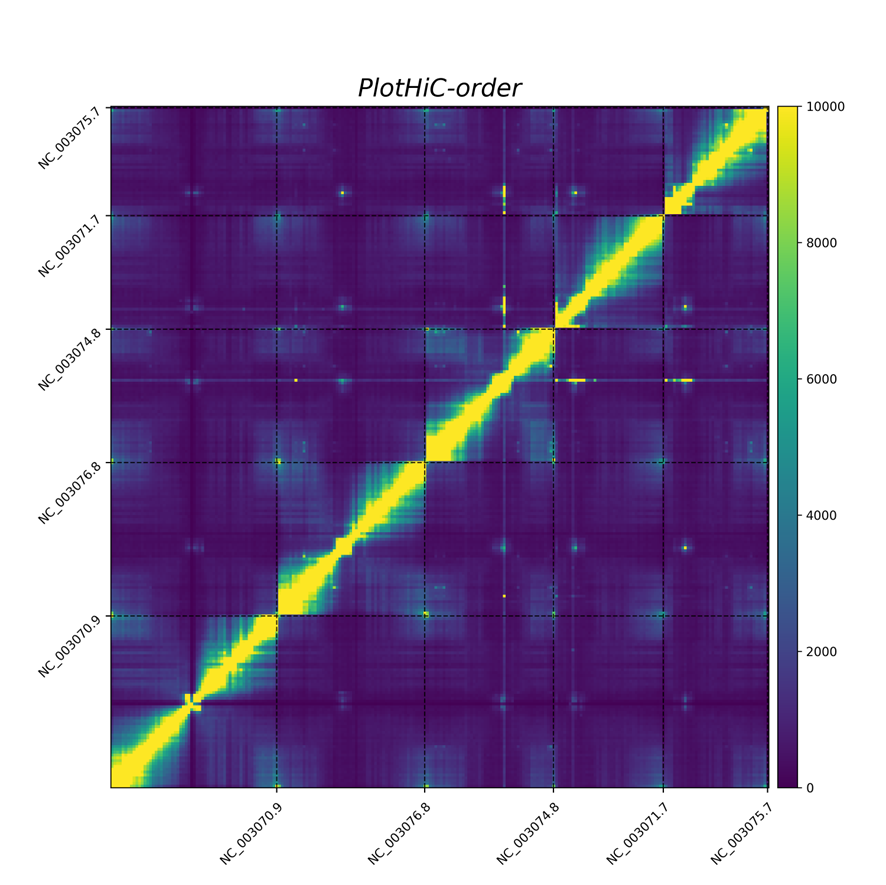
plothic -matrix sample_500000.matrix --abs-bed sample_500000_abs.bed -format png -cmap viridis --bar-max 10000 -g PlotHiC-order --abs-order order.txt

# --abs-order > Sort by the order in order.txt
- split chromosomes
plothic -matrix sample_500000.matrix --abs-bed sample_500000_abs.bed --bed-split

# --bed-split > set split chromosome visualization True
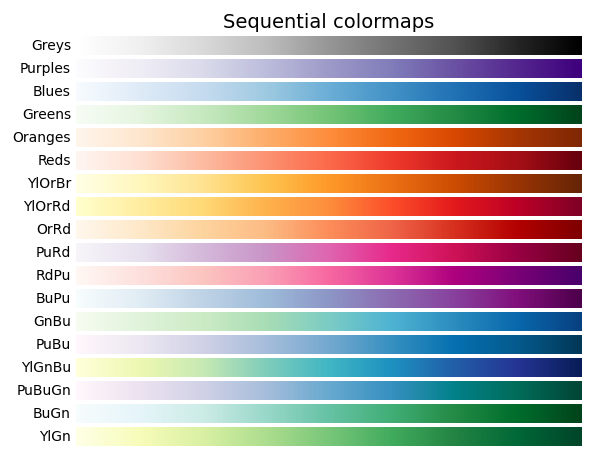
PlotHiC uses YlOrRd by default, you can choose more colors from Matplotlib.
If you have any questions, please Open Issues or provide us with your comments via the email below.
If you used PlotHiC in your research, please cite us:
Zijie Jiang, Zhixiang Peng, Zhaoyuan Wei, Jiahe Sun, Yongjiang Luo, Lingzi Bie, Guoqing Zhang, Yi Wang, A deep learning-based method enables the automatic and accurate assembly of chromosome-level genomes, Nucleic Acids Research, 2024;, gkae789, https://doi.org/10.1093/nar/gkae789
