-
Notifications
You must be signed in to change notification settings - Fork 28
Home

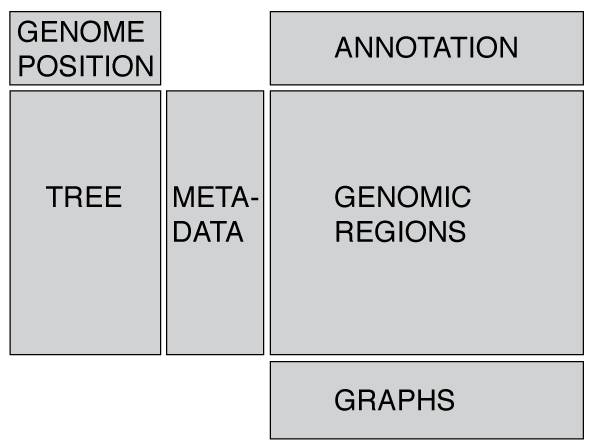
Phandango is a fully interactive tool to allow visualisation of a phylogenetic tree, associated metadata and genomic information such as recombination blocks, pan-genome contents or GWAS results. It's an interactive web app, so you just open this page and drag your data files onto the browser (see Input data formats), or load any of the examples available on the page.
- Panel Layout
- Phylogeny
- Metadata
- Genome Annotation
- Recombination Blocks / Pan genome blocks
- Line graph
- GWAS results
- Resizing panels
- Roadmap
- F.A.Q.
- Saving as a vector image
- Browser quirks
- My data didn't display!?!
- Is my data being uploaded to a server?
- I've found a bug!
- Licence
- Contact

The layout is designed around a phylogeny and a linearized genome, but these are not essential! For instance, you can display just a tree with metadata, or just a genome annotation and GWAS results. The layout is designed to be flexible and display whatever data you provide, and you may resize the panels as you see fit. If you would like to visualise geographical data, such as GPS co-ordinates then you may want to take a look at microreact.
#### Phylogenetic tree * You may zoom with a trackpad / mouse wheel, and by holding ctrl/cmd you can zoom the tree in the horizontal direction only. * Drag the tree to move it * Right clicking brings up some general display options * Right clicking on a node allows you to redraw the subtree We use [phylocanvas](http://phylocanvas.org/) created by the [Centre for Genomic Pathogen Surveillance] (http://www.sanger.ac.uk/science/collaboration/centre-global-pathogen-surveillance-cgps) to display the tree, so thanks to everyone involved! #### Metadata * Metadata appears as coloured blocks in line with the associated taxa in the tree (so a tree is essential). * Hovering over blocks shows you the data for each block * Pressing *k* toggles a key * In the settings menu (see link in header or press *s*) you may toggle columns on or off. * For help controlling the colours used see Input data formats #### Genome Annotation #### Genomic DataRecombination regions are displayed as coloured blocks relative to the taxa involved (vertical axis) and the genomic region affected (horizontal axis).
- Because Gubbins provides some metadata with each block (number of SNPs e.t.c), hovering over gubbins blocks displays this.
- Gubbins blocks are coloured red if they are ancestral, i.e. occured at a non-terminal node, and blue if they only affect one isolate, i.e. happened at the leaf.
- BRAT NextGen provides the homeCluster information with blocks which can be used to infer which part of the tree was the donor. These are indicated as a column of metadata and contribute the colour of the blocks.
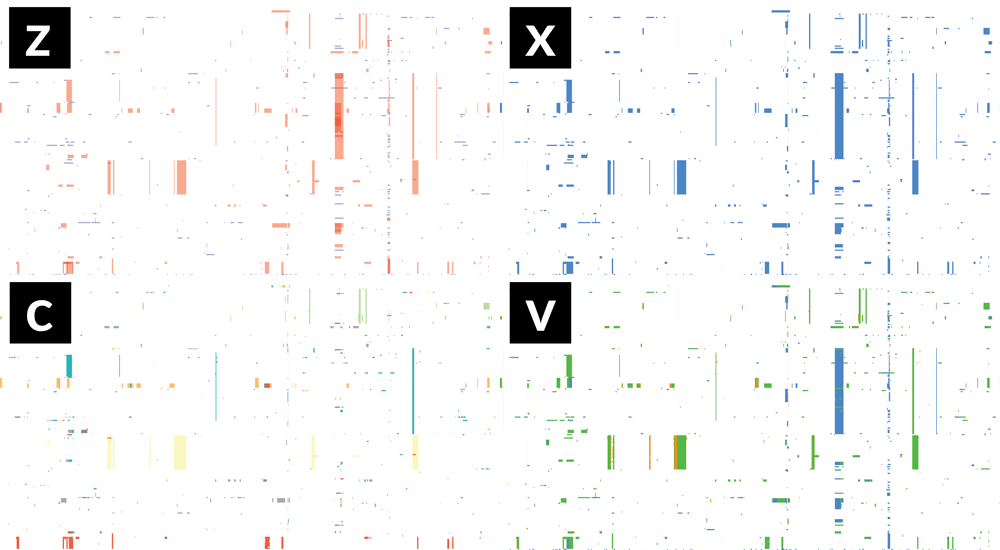
- If Gubbins and BratNextGen data are loaded, as in the PMEN1 example, you may toggle between the different datasets via the settings menu of the key shortcuts z, x, c and v, as shown in the following gif. This toggles between Gubbins (z); Gubbins Per Taxa, i.e. every event occurs at the leaf similar to BRAT NextGen (x); BRAT NextGen (c) and a merge (v), where Gubbins-only regions are blue, BRAT NextGen-only regions are orange and green indicates regions inferred by both algorithms.

Pan-genome content is displayed as presence / absence blocks relative to an ordering of genes and contigs which appear in the Genome Annotation panel. Hovering over each block shows you the individual gene name. Note that the ordering of the genes is specific to the input, and should not be thought of as a true genome annotation!
#### Line graph #### GWAS results #### Resizing panels The relative sizes of each panel may be adjusted two different ways: * Drag the small gray circles which are at the edge of each panel to resize in real time * Use the sliders in the settings menu * If the tree dissapears from view you may need to re-fit this by right clicking in the tree panel ## Roadmap Phandango is still under development - here's a list of (big) objectives for us, although there is no guarantee that these will be done. As always, we welcome contributions from anyone!- Back-button support
- Multiple plot display
- Multiple contig support (partially implemented)
- ClonalFrameML & fastGEAR input
- SNP display (VCF / tab file)
- Homoplasic SNP display
- Searching for gene / taxa
- Persist data via server & an obfusciated URL
- Display of r/m values, bootstrap support on tree nodes
- BEAST display
- Tree tips coloured by selected metadata
- Pressing p will save the data, as currently displayed, as a vector SVG file.
- The saved filename (in most browsers) is Phandango.svg, however in Safari this is downloaded as Untitled which must be manually renamed to .svg.
- SVG files can be opened in a browser or image editing program such as Illustrator or Inkscape
- imagemagick can be used to convert between SVG and PDF / PNG formats.
Many thanks to The Centre for Genomic Pathogen Surveillance (CGPS) especially Richard Goater.
Phandango makes use of: