-
Notifications
You must be signed in to change notification settings - Fork 787
Loop closure detection
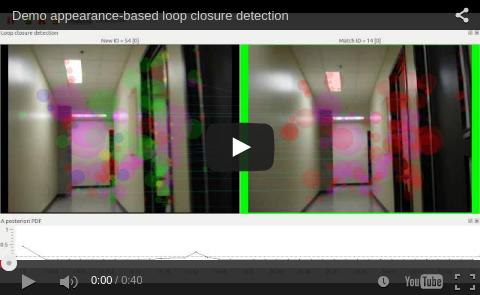
This simple example shows how to use RTAB-Map to process a data set.
-
Open RTAB-Map application. At the first execution, you should see a dialog saying that a working directory is created in your "Documents" folder, click ok. This working directory holds the database and log files.

-
At this point, you should see the main window of RTAB-Map.

-
Setup parameters for appearance-based mapping only. Download this file settingsAppearanceDemo.ini, open Edit->Preferences->General settings. Click on "Reset settings" to start from default parameters, then click on "Load settings" and select the file you have just downloaded. Here are information about which parameters are modified from the default ones:
- RGBD/Enabled = False (disable metric stuff)
- Rtabmap/ImageBufferSize = 0 (process all images)
- Rtabmap/DetectionRate = 0 (go as fast as the camera publishes images)
- Mem/RehearsalSimilarity = 0.4
- Mem/STMSize = 15
- Mem/RehearsalIdUpdatedToNewOne = true
- Mem/BadSignaturesIgnored = true (ignore images with little or no features)
-
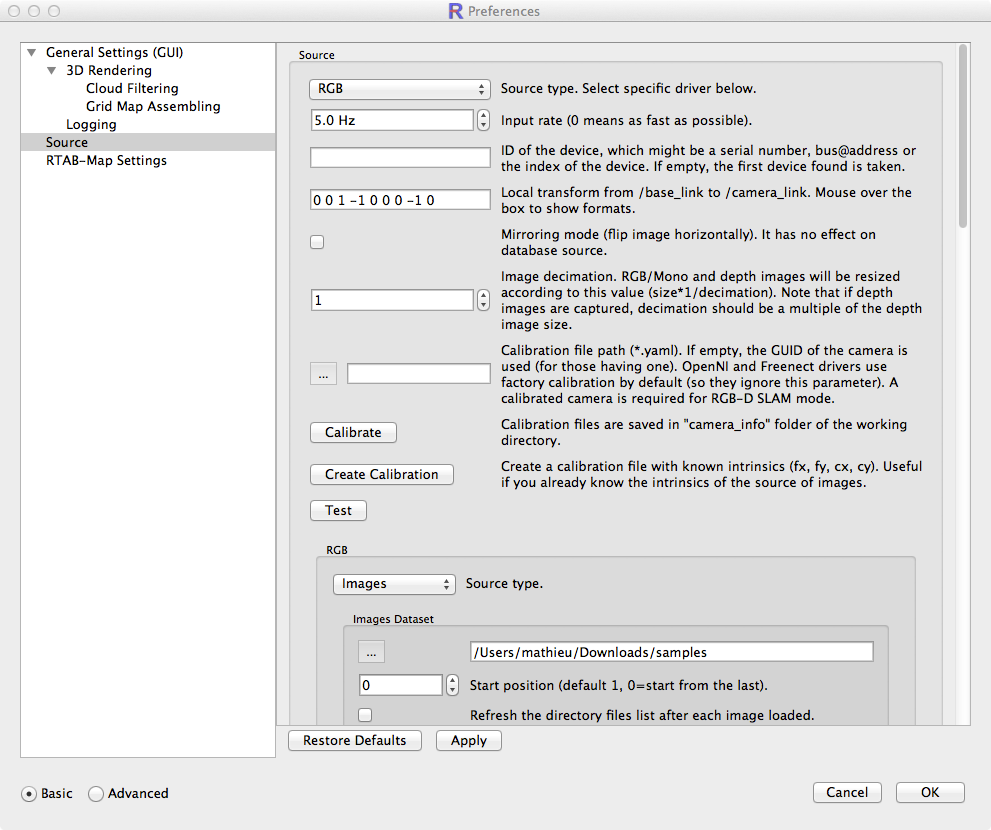
Setup the source of the camera. For this example, download this sample data set and extract it anywhere. Open menu Detection -> "Select Source" -> "More options..." (or Preferences->Source panel), then select "Source" -> "RGB". Scroll down to RGB section and select "Images" instead of "Usb camera", then select the directory containing images just extracted. Make sure the input source is not 0 Hz (otherwise the images will be processed very fast).
-
Click on "New database", then "Start" button in the toolbox of the main window. You should see briefly an initialization dialog and the detection will start;

-
You can click on menu "Detection"->"Pause on match" to make the detector pause when an accepted loop closure is found.

-
Colors legend :
- Blue = feature found in the previous image (when almost all features are blue, this means that the current image is merged with the previous one, increasing the weight).
- Red = feature found in the dictionary.
- Green = feature not found in the dictionary (so it is a new feature).
- Yellow = same as Green, but found more than one time in the image.
- Pink = feature found in the two images.
-
When the last image (84) is processed, click Menu Window -> "Show view" -> Statistics. This will open a panel showing statistics. For this tutorial, look only information in the top part of the panel. We can see the number of loop closures detected/rejected.

- You can try with larger data sets that you can find at RTAB-Map on IntRoLab:
