-
Notifications
You must be signed in to change notification settings - Fork 0
Graphite
Gatling offers a way to have some live statistics through Graphite so that you don't have to wait for the generation of the final report to see what happens.
This way, you can also monitor what happens on the client side AND the server side and collect all the data in one central repository.
In $GRAPHITE_HOME/conf/storage-schemas.conf:
[Gatling stats]
priority = 110
pattern = ^gatling\..*
retentions = 1s:6d,10s:60d
In $GRAPHITE_HOME/conf/storage-aggregation.conf:
[sum]
pattern = \.count$
xFilesFactor = 0
aggregationMethod = sum

[min]
pattern = \.min$
xFilesFactor = 0.1
aggregationMethod = min

[max]
pattern = \.max$
xFilesFactor = 0.1
aggregationMethod = max

[default_average]
pattern = .*
xFilesFactor = 0.3
aggregationMethod = average
In $GATLING_HOME/conf/gatling.conf, be sure to :
- have the GraphiteDataWriter in the list of writers
- have the correct host and port for Graphite
data {
  writers = [console, file, graphite]
  reader = file
}
graphite {
  host = "192.168.56.101"
  port = 2003
  bucketWidth = 100
}
Two types of metrics are provided by Gatling :
- Users metrics
- Requests metrics
Users metrics give you, for each scenario of your simulation (or all scenarios using allUsers) :
- waiting : # of users waiting to start the scenario
- active : # of users currently running the scenario
- done : # of users who have completed the scenario
The metric path for users metrics is gatling.scenarioName.users.category, where :
- scenarioName is the name of your scenario
- metric is one of the metrics described above
Requests metrics give you, for each request (or all requests using allRequests) and by status (OK, KO and both) :
- count : requests/sec
- min and max : Min and Max response time for the request
- percentilesXX : First and second percentiles, as defined in gatling.conf (defaults are 95th and 99th percentiles)
The metric path for requests metrics is gatling.scenarioName.requestName.status.metric, where :
- scenarioName is the name of your scenario
- requestName is the name of your request
- status is either ok (for successful requests), ko (for failed requests) or all (for both successful and failed requests)
- metric is one of the metrics described above
All the following charts have been done with this line mode : Graph Options\Line Mode\Connected Line
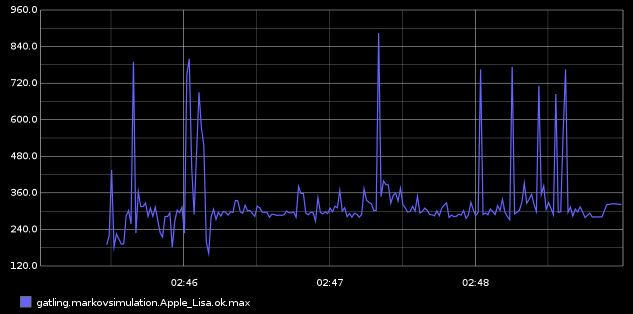
Graphing the .max is usally a good start to monitor a given request.

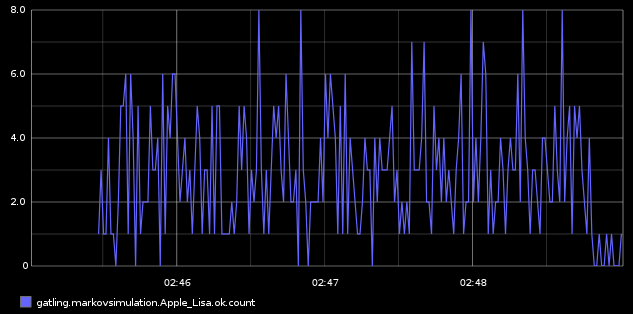
One may be interested in monitoring the number of requests per second with .count.

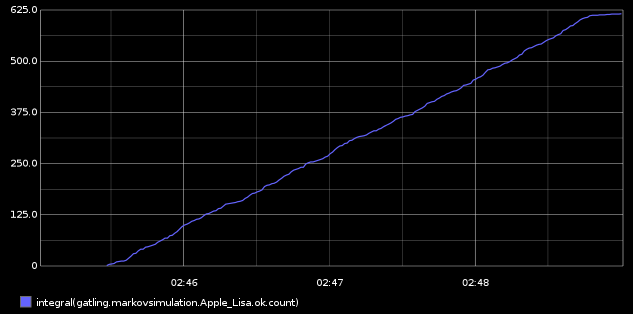
One can easily graph the total number of requests executed thanks to the Graphite integral() function.

- Introduction
- Underlying Technologies
- Concepts
- Sponsors
- Changelog
- Migrating
- Continuous Integration
- Benchmarks
- License
- FAQ
- Contributing
- Events
- Links
- Tutorial
- Reference
- Cookbooks
- Extensions
- General information
- APIs
- Checks API
- Request API
- Charting API
- Feeder API