ELK Timelion's data source for Grafana
Set the url for your ES server like: http://server:port/api/timelion (Same server where your Kibana instance is running)
Only query datasource feature is implemented.
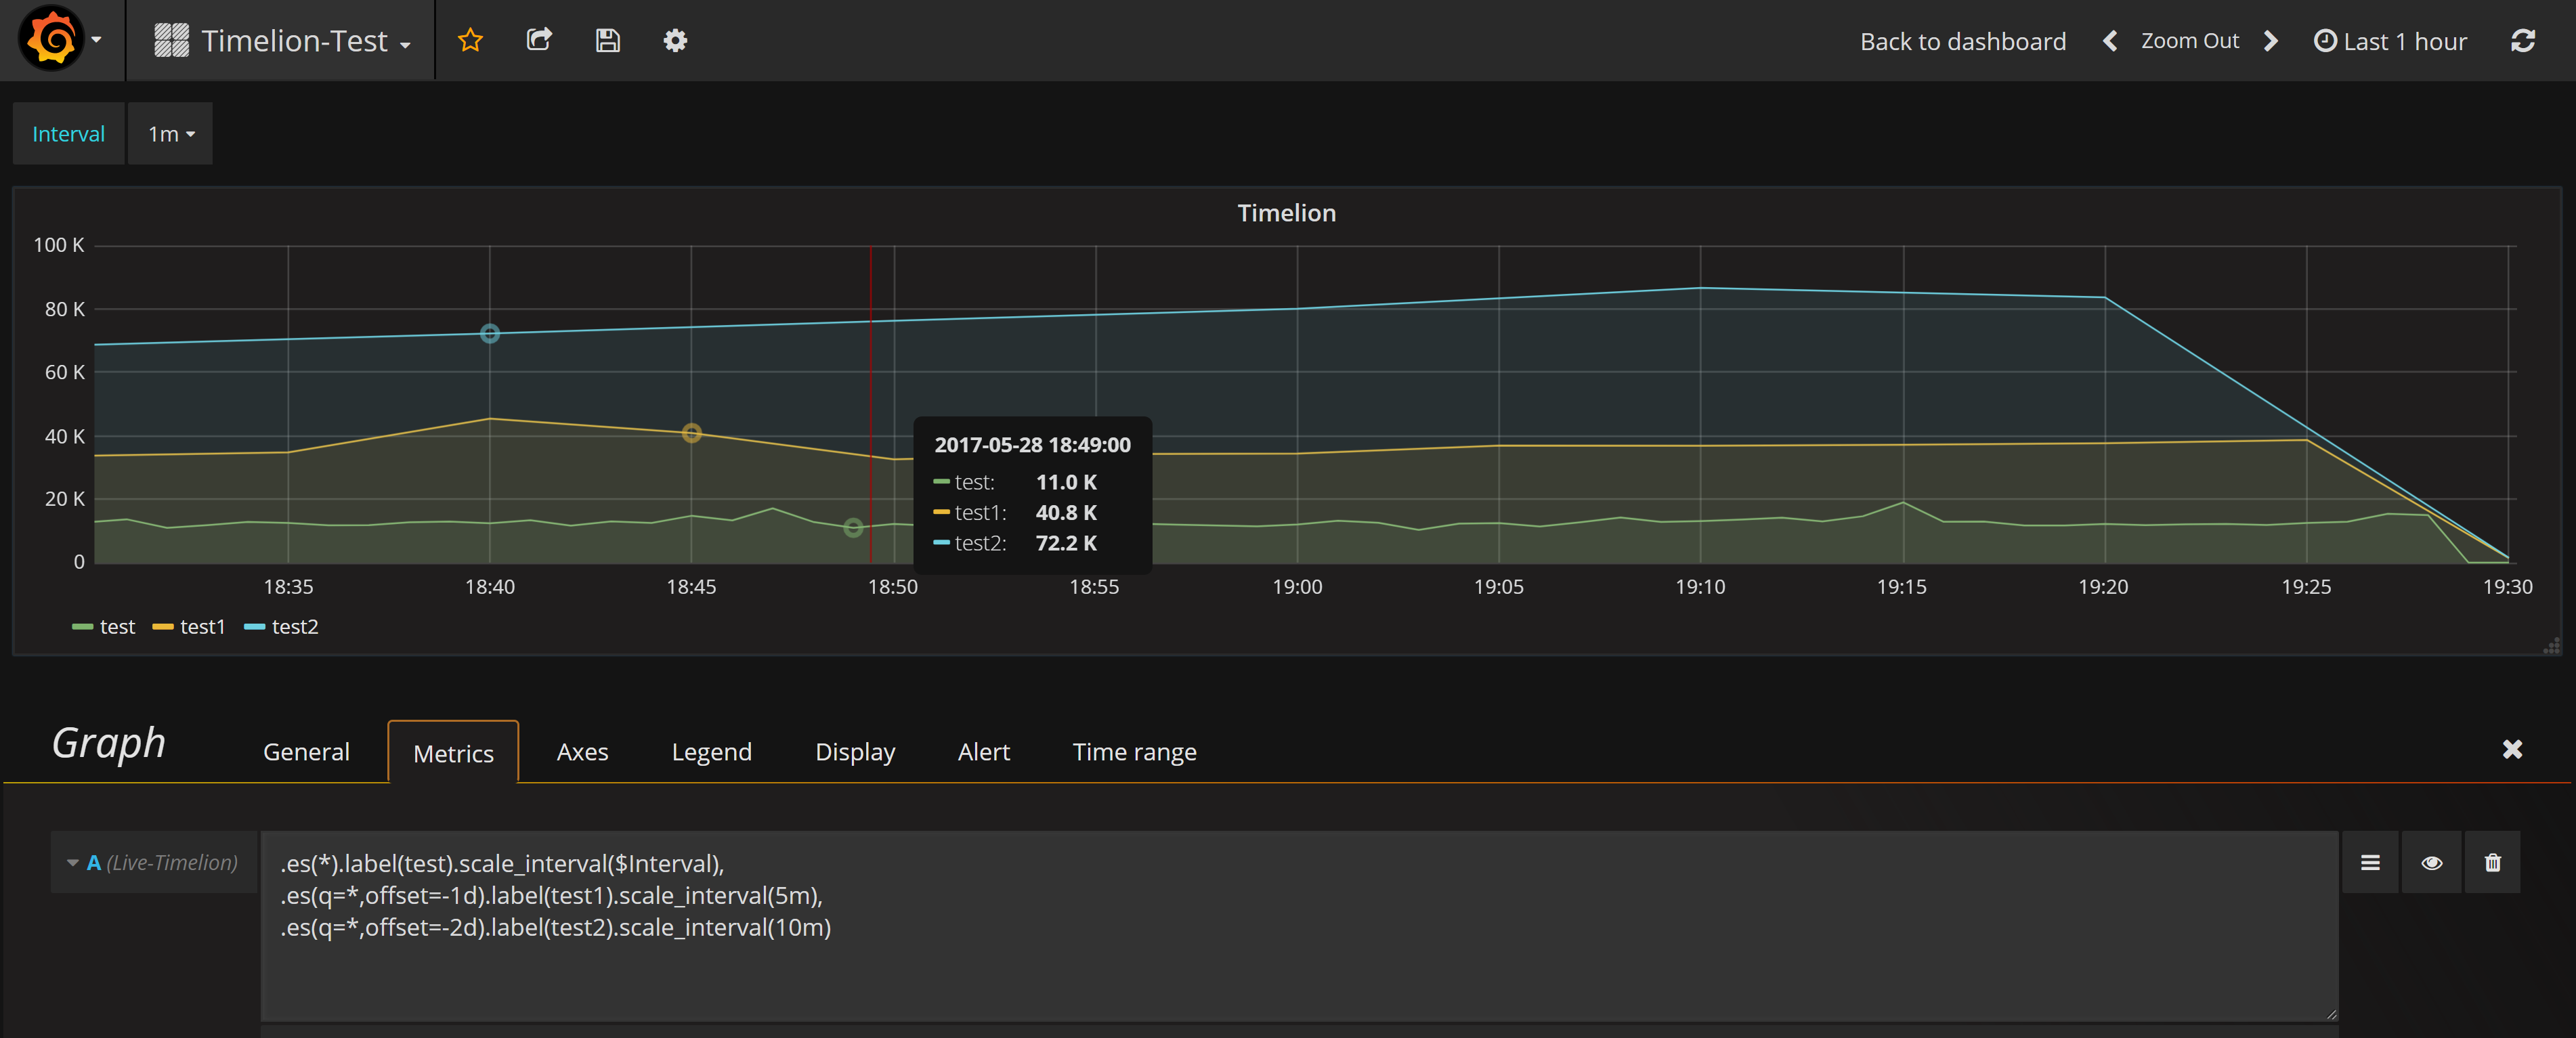
Multiple queries can be specified using same metric like: .es(*).label(metric1),.es(q=*,offset=1d).label(metric2)
Or defining multiple metrics.
Refer to Timelion's documentation for more details on writing queries: https://github.com/elastic/timelion/blob/master/FUNCTIONS.md
Use the label() function to set the name of the metric
Use the scale_interval() function to specify metric interval. Grafana templating values are allowed
Starting with version 1.0.1 you can retrieve variables from Timelion labels.
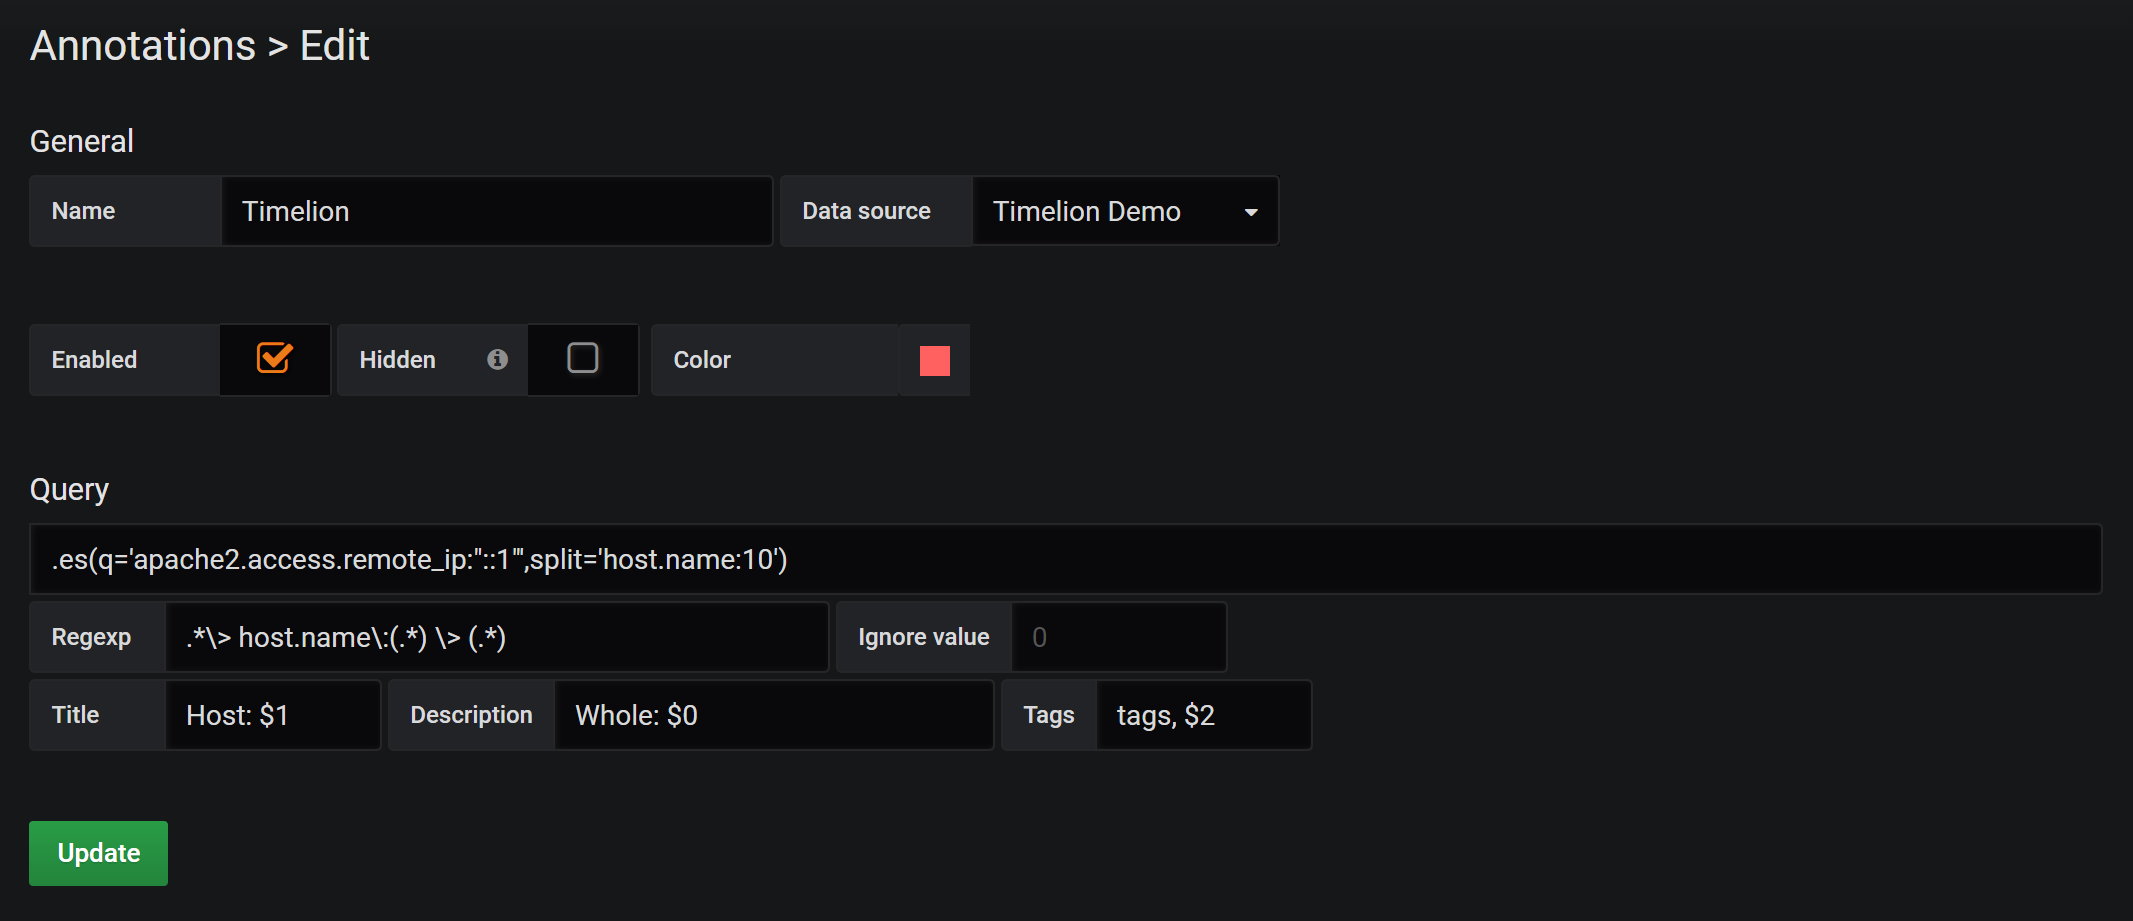
You can query annotations using Timelion as follow:
Notes:
- Data will be returned as
<label>: <value>exampleq* > host > count: 10 - Define a regexp to split label and use capture groups for: title, description, tags
- Timelion always returns a data point for each tick in the time range. Use
Ignore valueto discard invalid values. Default value is 0.
have fun!
Grafana team and @bergquist


