#dotplot - Rapid dot plots in R.
This package makes dotplots from DNA sequences. It is modeled after the dotPlot function contained within the seqinr package, but it doesn't take a million years to produce the plot because it uses compiled code to compute the regions of similarity and uses the faster raster functions added to R in 2011 instead of the older and very time consuming image function call.
#Installation
install.packages("devtools")
library(devtools)
install_github("evolvedmicrobe/dotplot", build_vignettes = FALSE)
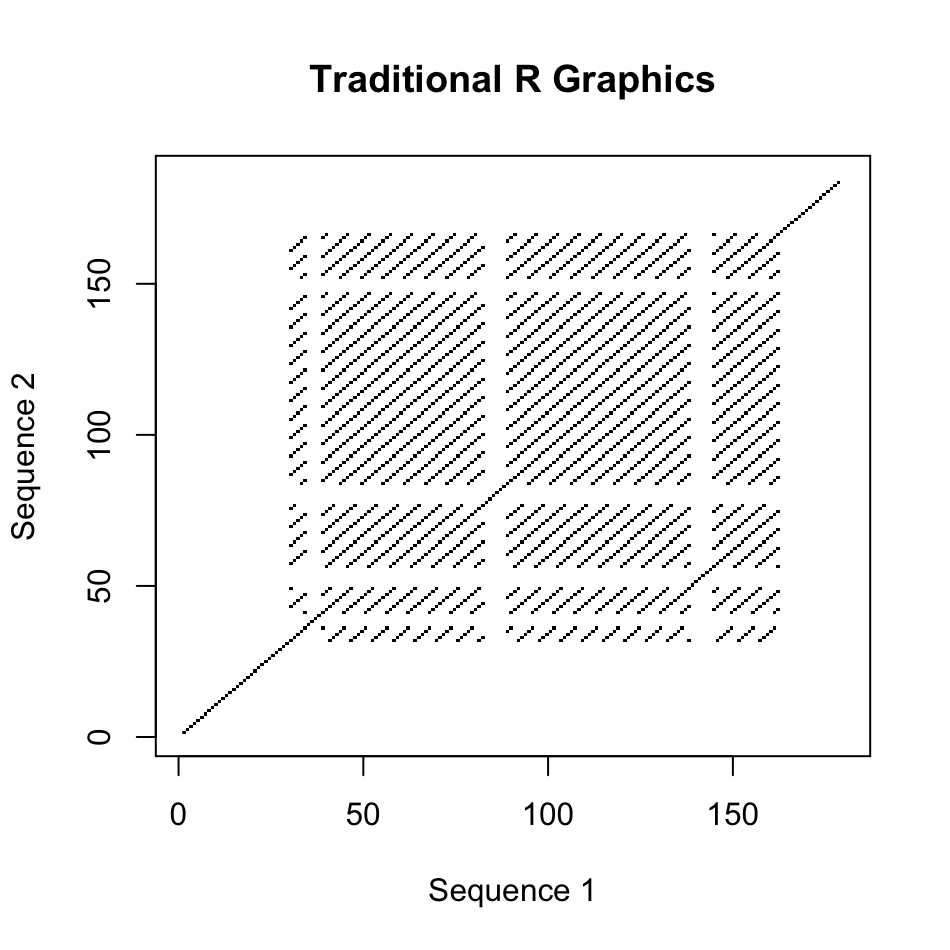
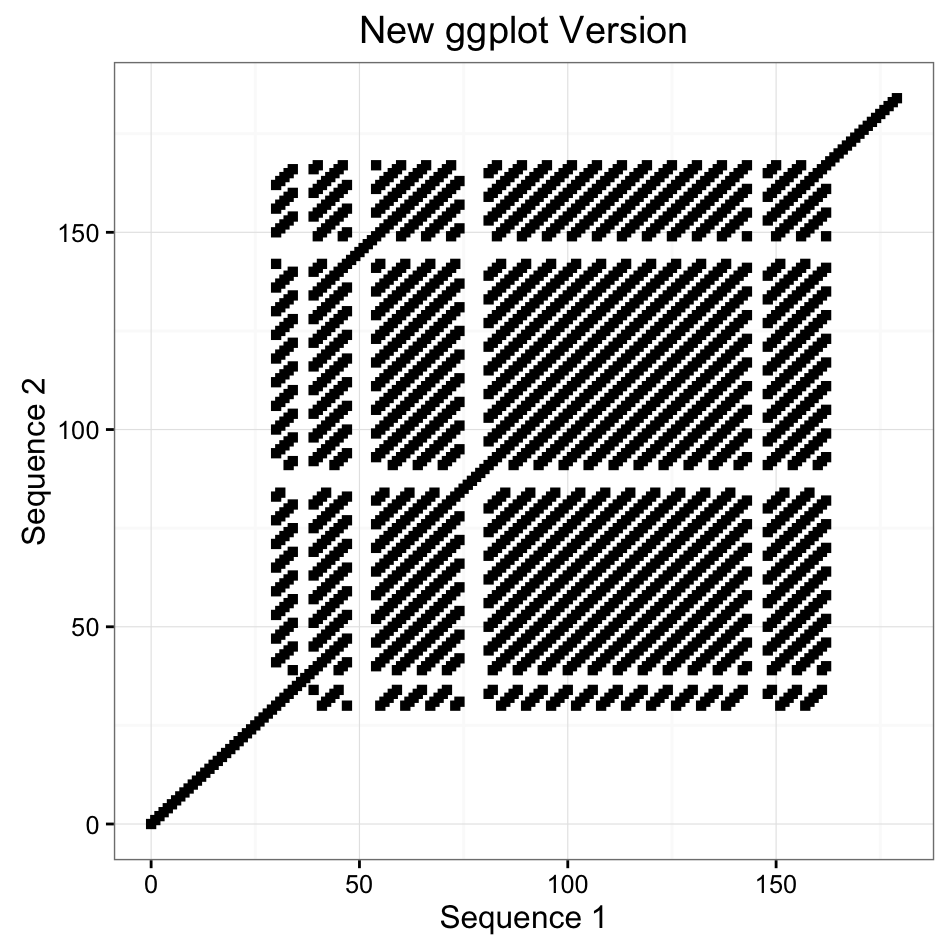
There are two style of plots one can produce, either the older base graphics type as originally used in the seqinr package or a newer ggplot version. In addition to the aesthetic differences between these plots, for large sequences with sparse similarity, the ggplot version allows a region of similarity to take over more space than one pixel, while the older version strictly uses one pixel per coordinate pair as in the original function.
seq1 = "ATGAATACTAGATAGCATAGAGATAGACTATTAGGGTTAGGTTAGGGTTAGGGTGTTAGGGTTAGGGTTAGGGTTAGGGTTGGGTTAGGGTTAGGGTTAGGGTTAGGGTTAGGGTTAGGGTTAGGGTTAGGGTTAGGGTTAGGGTTAGGGGTTAGGGTTAGGGTTAGGGCCGCACCGAGCGCATACA"

seq2 = "ATGAATACTAGATAGCATAGAGATAGACTATTAGGGTTAGGTTAGGGTTAGGGTTAGGGTTAGGGTTAGGGTTAGGGTTAGGGTTAGGGTTGGGTTAGGGTTAGGGTTAGGGTTAGGGTTAGGGTTAGGGTTAGGGTTAGGGTTAGGGTGTTAGGGTTAGGGTTAGGGTTAGGGCCGCACCGAGCGCATACA"

library(dotplot)
# Older Base Graphics Plot
dotPlotm(seq1, seq2, wsize = 7, xlab="Sequence 1", ylab="Sequence 2", main="Traditional R Graphics")

# Newer ggplot Version
library(ggplot2)
dotPlotg(seq1, seq2, wsize=7) + theme_bw() + labs(x="Sequence 1", y = "Sequence 2", title="New ggplot version")

