Examples, Showcase Applications and Tutorials for SciChart.WPF: High Performance Realtime WPF Chart Library.
WPF Chart Examples are provided in C# / WPF. If you are looking for other platforms then please see here:
- iOS Charts (Swift / Objective C)
- Android Charts (Java / Kotlin)
- Xamarin Charts (C#) BETA!
- NativeScript Charts (TypeScript / Javascript) BETA!
To build, you will need to set the correct NuGet feeds for SciChart WPF v4.x and v5.x. NuGet Feed setup instructions are found at the page Getting Nightly Builds with NuGet
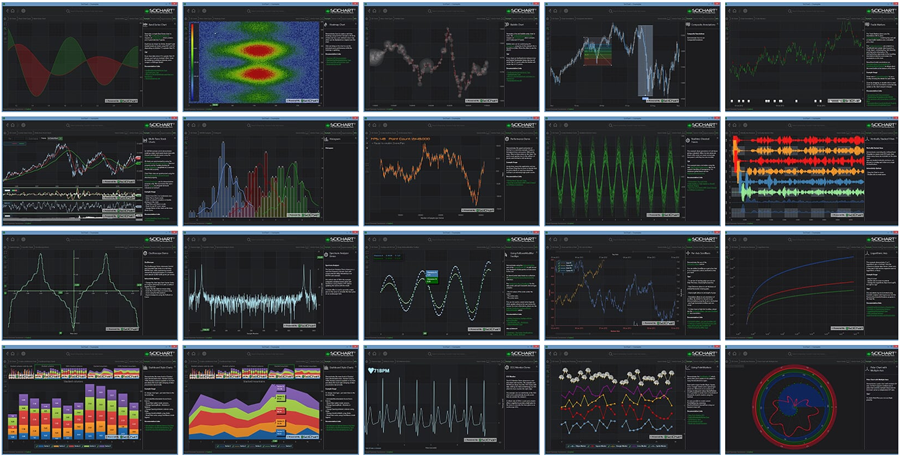
The SciChart WPF Examples Suite demonstrates 2D & 3D WPF Chart types, as well as featured apps which show the speed, power and flexibility of the SciChart.WPF Chart library.
This showcase is written in WPF with MVVM, Unity Container and Reactive Extensions and is designed to be a demonstration of what SciChart WPF can do.
SciChart WPF Includes the following 2D & 3D chart types, as well as an wide set of features, excellent performance and a poweful, flexible API.
- WPF Line Chart
- WPF Band Chart
- WPF Candlestick Chart
- WPF OHLC Chart
- WPF Column Chart
- WPF Pie Chart
- WPF Donut Chart
- WPF Mountain / Area Chart
- WPF Scatter Chart
- WPF Impulse / Stem Chart
- WPF Bubble Chart
- WPF Error Bars Chart
- WPF Stacked Mountain Chart
- WPF Stacked Column Chart
- WPF 100% Stacked Mountain Chart
- WPF 100% Stacked Column Chart
- WPF Radar Chart (v5+ Only)
- WPF Heatmap Chart
- WPF Spectrogram Chart
- WPF Polar Chart
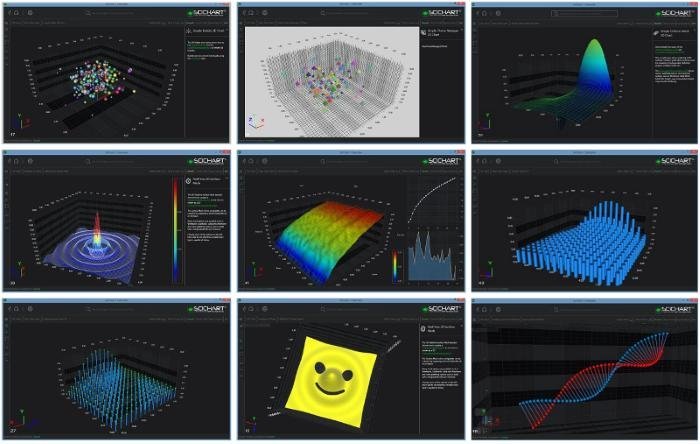
SciChart WPF also has an array of DirectX-powered Realtime 3D Charts for WPF, including:
- WPF 3D Bubble Chart
- WPF 3D Point Cloud Chart
- WPF 3D Scatter Chart
- WPF 3D Column Chart
- WPF 3D Surface Mesh Chart
- WPF 3D Impulse Chart
- WPF 3D Waterfall Chart (v5+ Only)
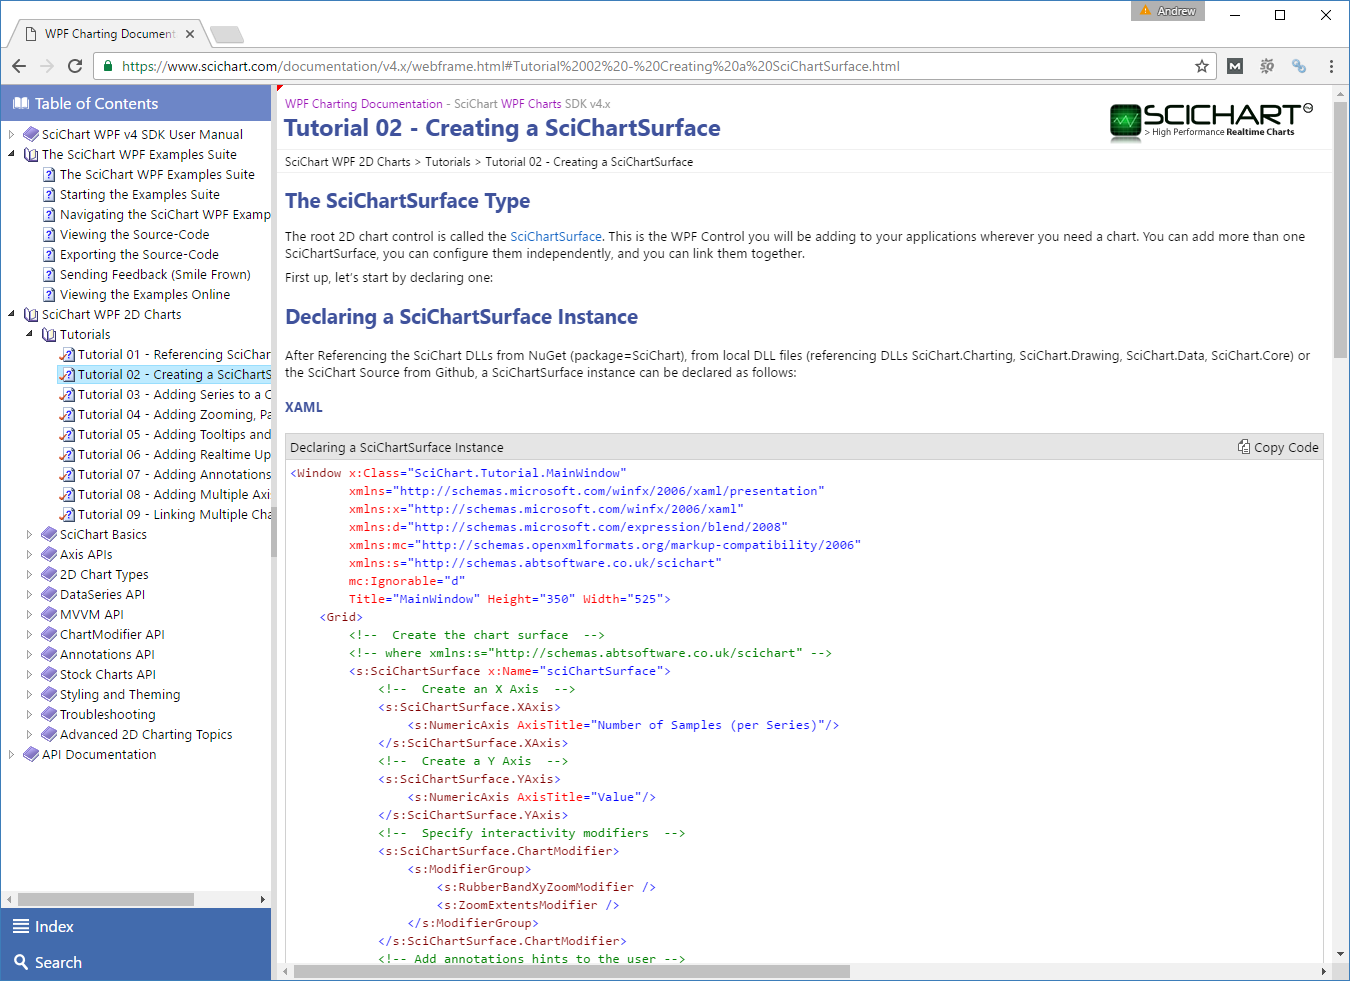
SciChart WPF Comes with a number of tutorials to help you get started quickly using our powerful & flexible chart library! Please see below:
- Tutorial 01 Referencing the SciChart Dlls
- Tutorial 02 Creating A SciChartSurface
- Tutorial 03 Adding Series
- Tutorial 04 Adding Zooming Panning
- Tutorial 05 Adding ToolTips And Legends
- Tutorial 06 Adding RealTime Updates
- Tutorial 07 Annotations
- Tutorial 08 Adding Multiple Axis
- Tutorial 09 Adding Multiple Charts
A place to put ideas, examples for users to answer support requests and more.
To build, you will need to set the correct NuGet feeds for SciChart WPF v4.x and v5.x. NuGet Feed setup instructions are found at the page Getting Nightly Builds with NuGet


