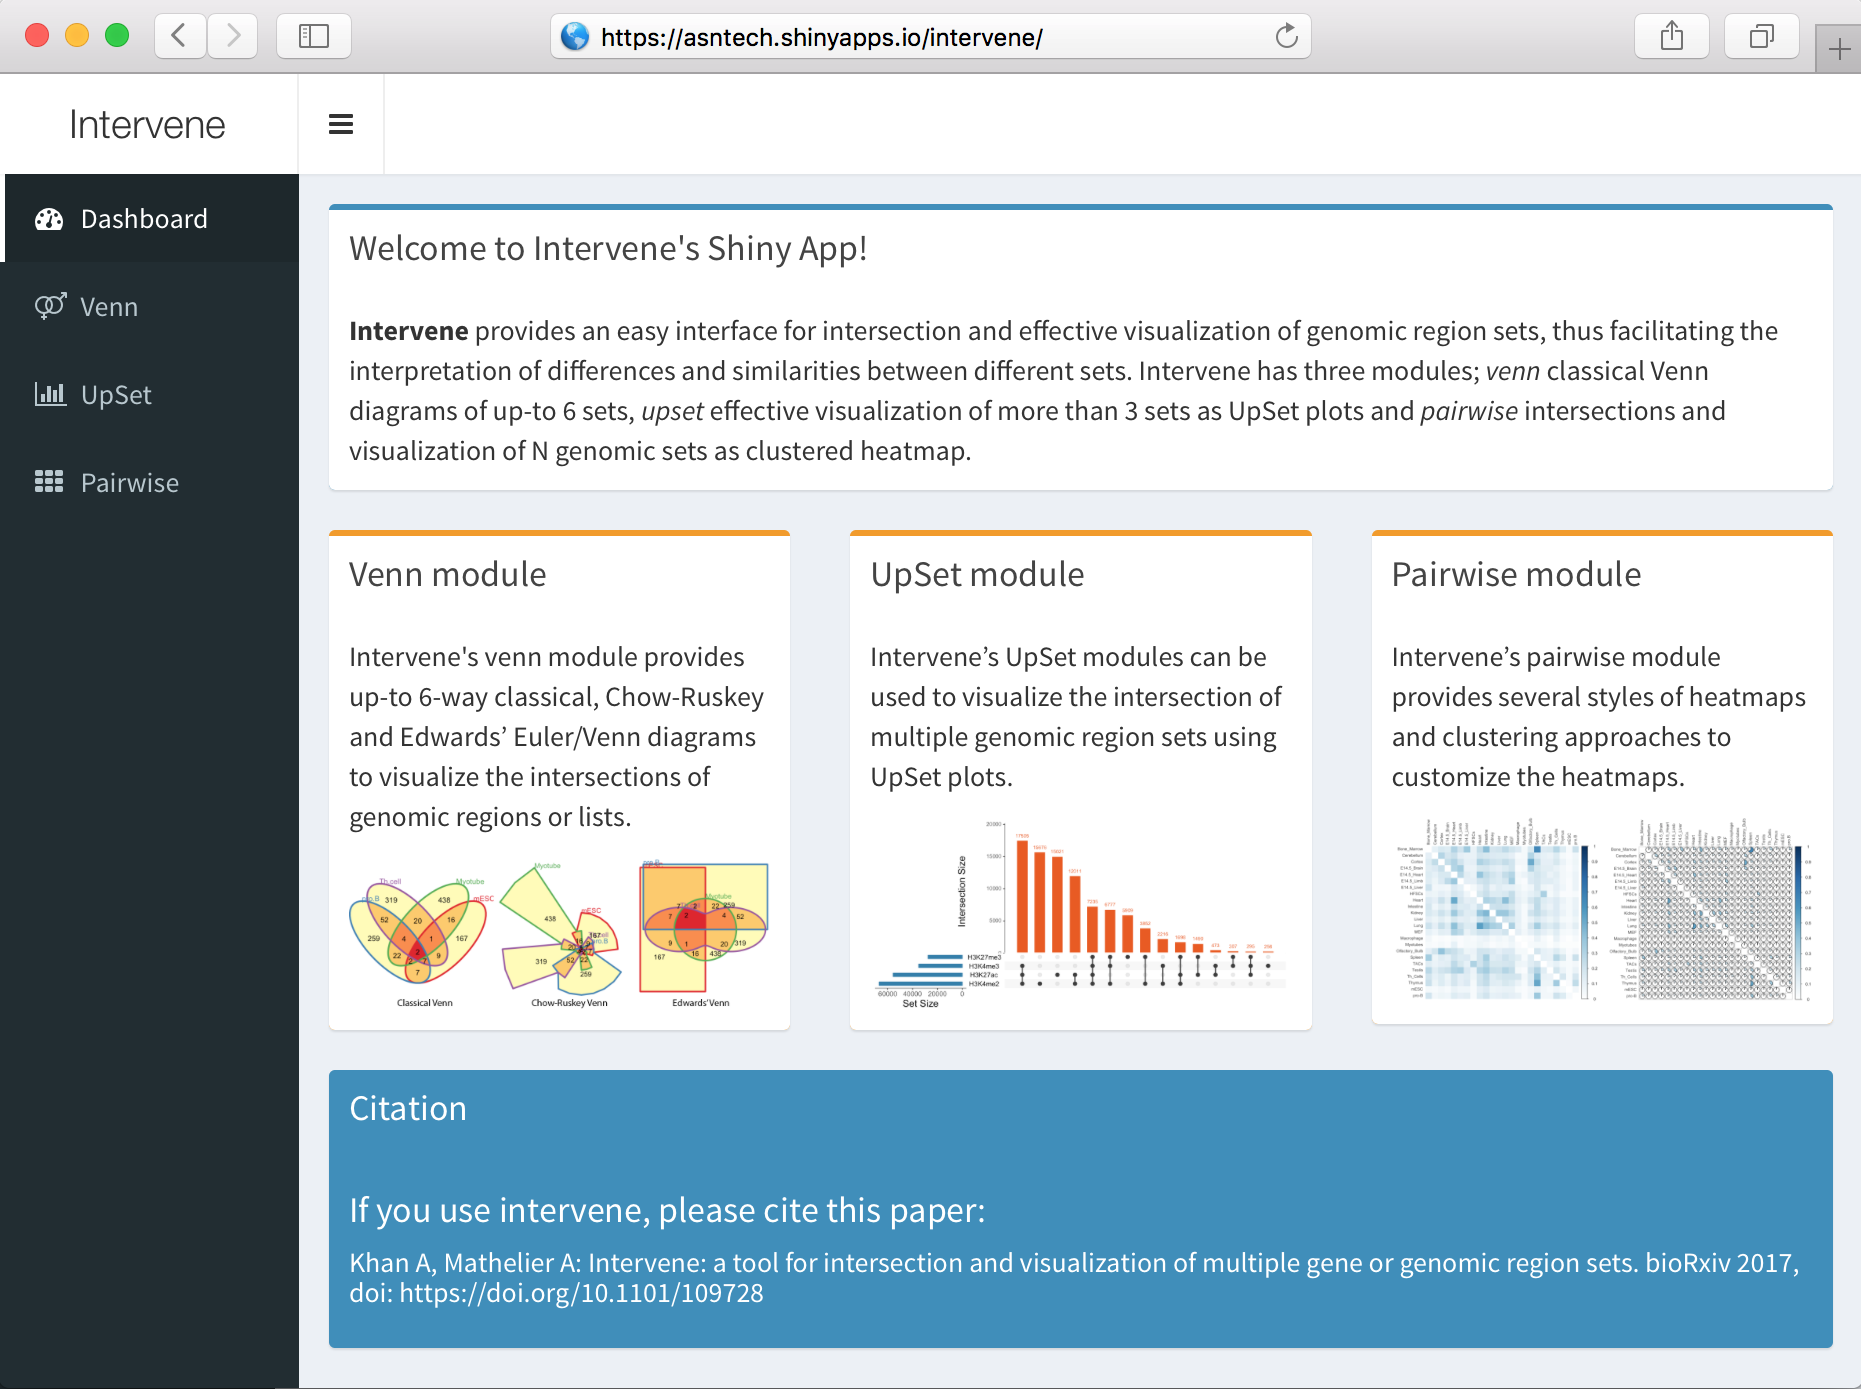
An interactive Shiny App for UpSet plots, Venn diagrams and Pairwise heatmaps
Intervene Shiny App provides an interactive interface for intersection and effective visualization of gene or genomic region sets. Currently, Shiny app does not acccept genomic regions as input, but the text files generated by Interve's command line interface can be easily uploaded to further explore and customize the plots in an interactive way. Intervene has three modules:
- venn to generate Venn diagrams of up-to 6 sets,
- upset to generate UpSet plots of more than 3 sets and
- pairwise to compute and visualize pariwise intersections as clustered heatmap.
Install the following packages:
install.packages(c("shiny","shinydashboard", "devtools", "d3heatmap", "plotly", "gplots", "ggplot2", "gridExtra", "plyr", "UpSetR", "colourpicker", "corrplot", "BBmisc", "readr", "DT"));
source("https://bioconductor.org/biocLite.R"); biocLite(c("RBGL","graph"));
library(devtools); install_github("js229/Vennerable");Intervene Shiny App is freely available at
OR
If you have questions, or found any bug in the program, please write to us at aziz.khan[at]ncmm.uio.no
If you use Intervene please cite us:
Khan A, Mathelier A. Intervene: a tool for intersection and visualization of multiple gene or genomic region sets. BMC Bioinformatics. 2017;18:287. doi: 10.1186/s12859-017-1708-7
