-
Notifications
You must be signed in to change notification settings - Fork 21
Exploring Grafana WEB interface for CNSA project in a k8s OCP environment
The Grafana application host URL is stored in the grafana-route instance.
Example output:
[[email protected] ~]# oc get route -n $NAMESPACE
NAME HOST/PORT PATH SERVICES PORT TERMINATION WILDCARD
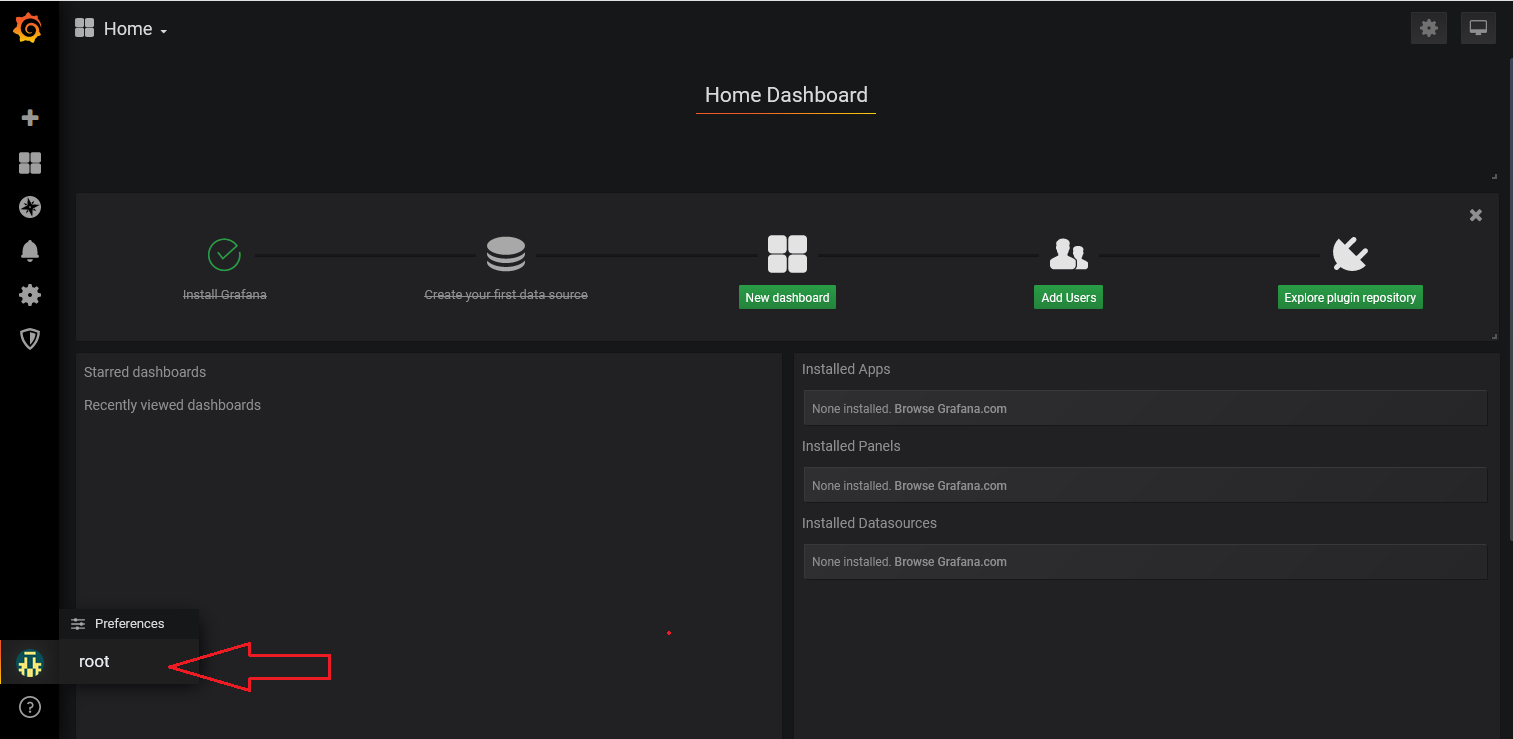
grafana-route grafana-route-grafana-for-cnsa.apps.hw.cp.fyre.ibm.com grafana-service 3000 edge None
In a browser put the 'HOST/PORT' URL to open a Grafana user interface. Click on ‘Sign In’ from the bottom left menu of Grafana, and log in using the default username and password configured earlier(root/secret).
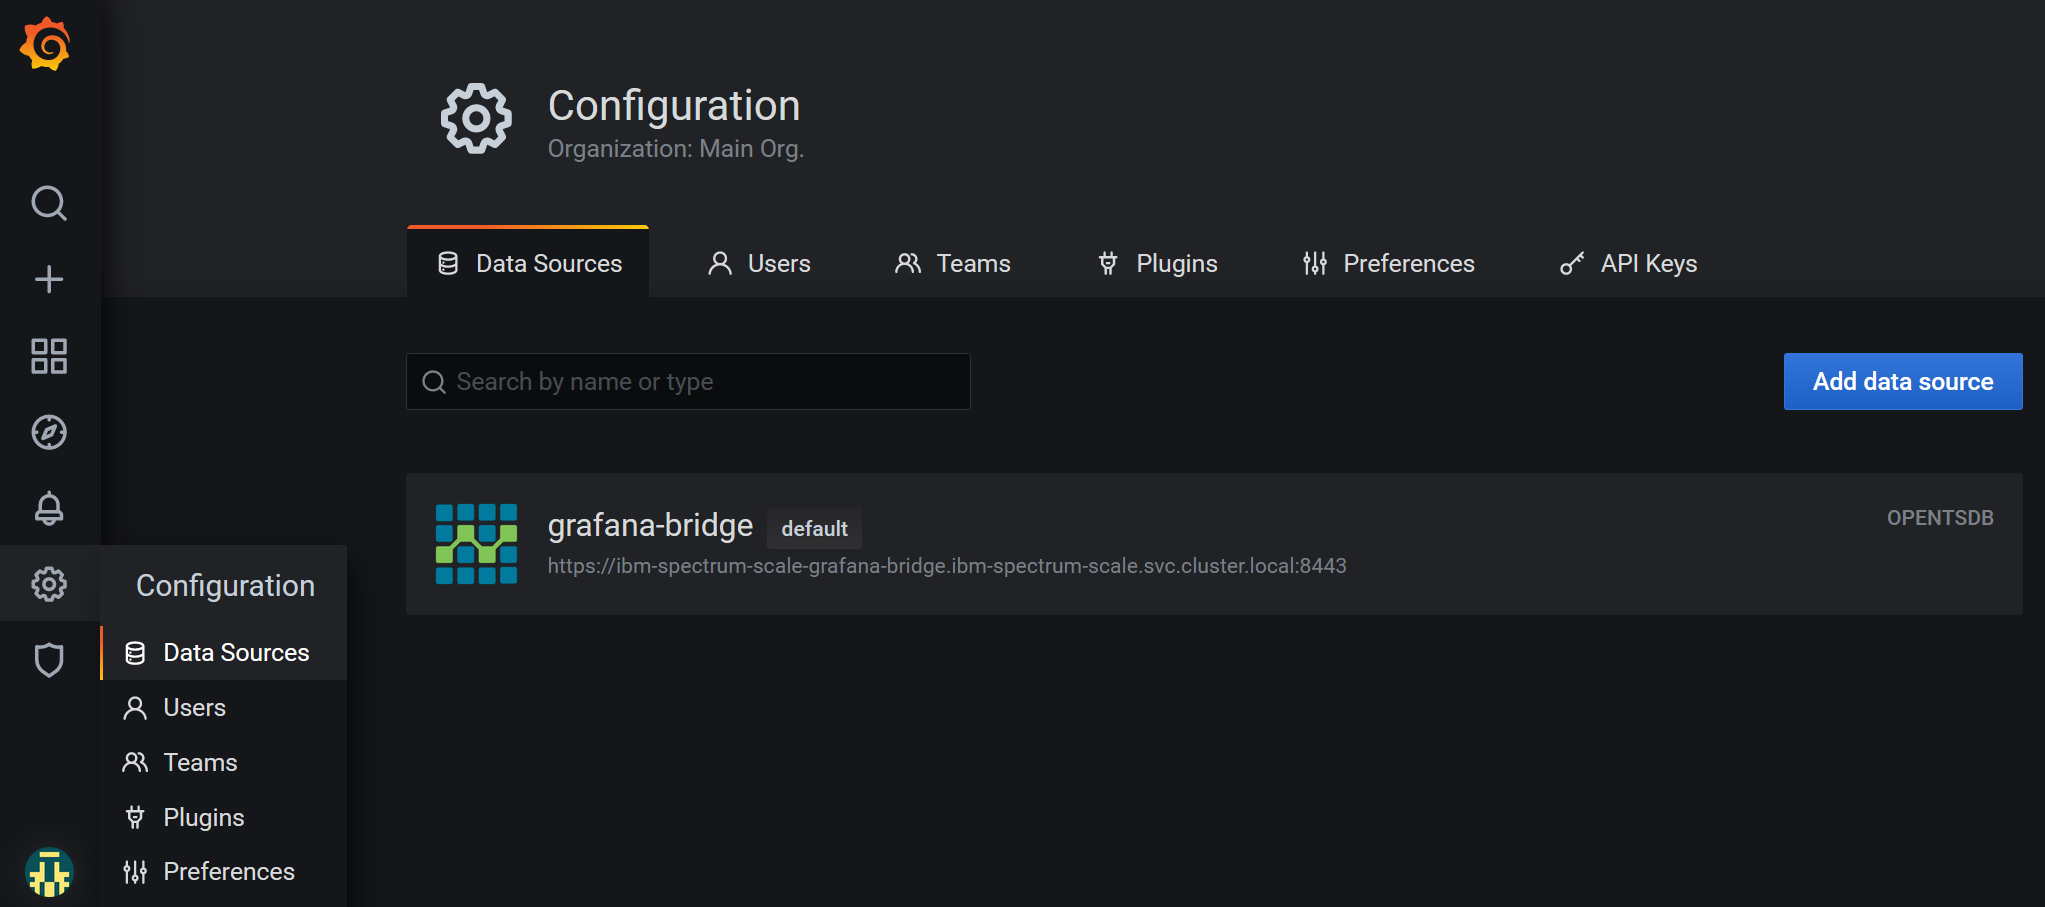
Click on Configuration > Data Sources in the side menu and you’ll be taken to the data sources page where you can review and test grafana-bridge datasource settings.
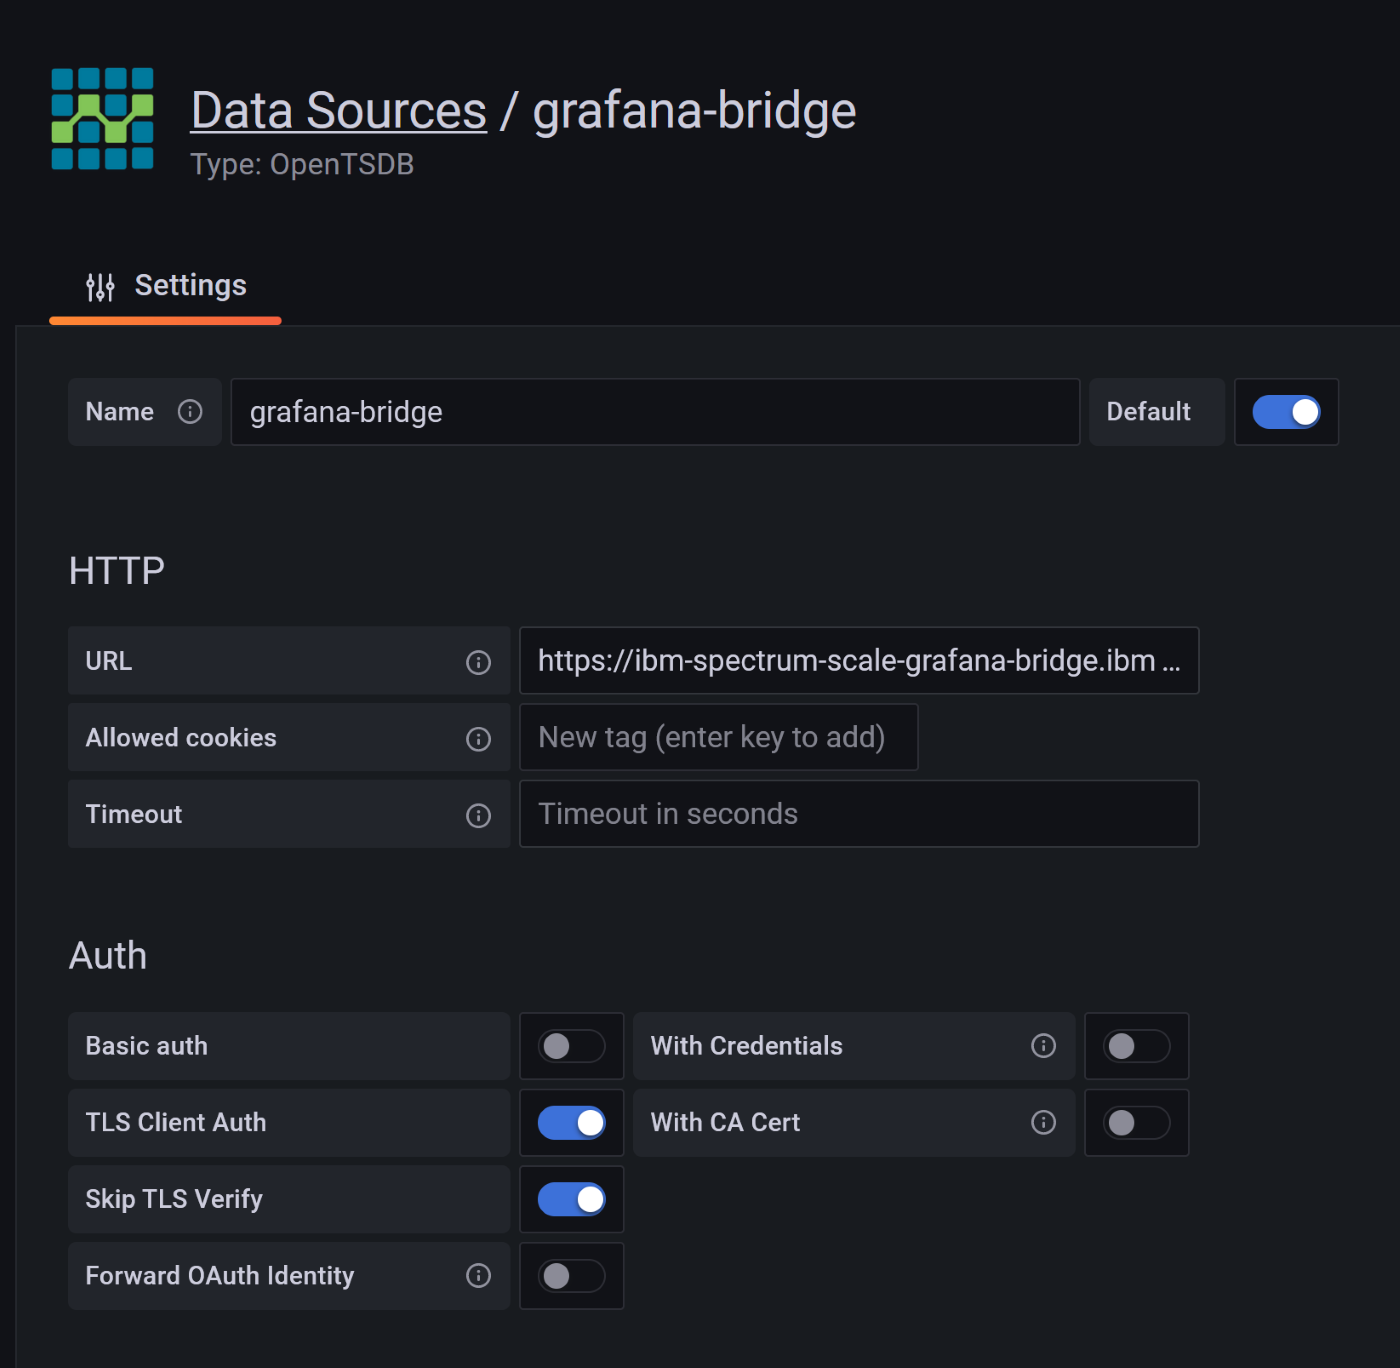
In the OpenTSDB settings make sure the version "2.3" is selected. Finally click on 'Save & Test' button.
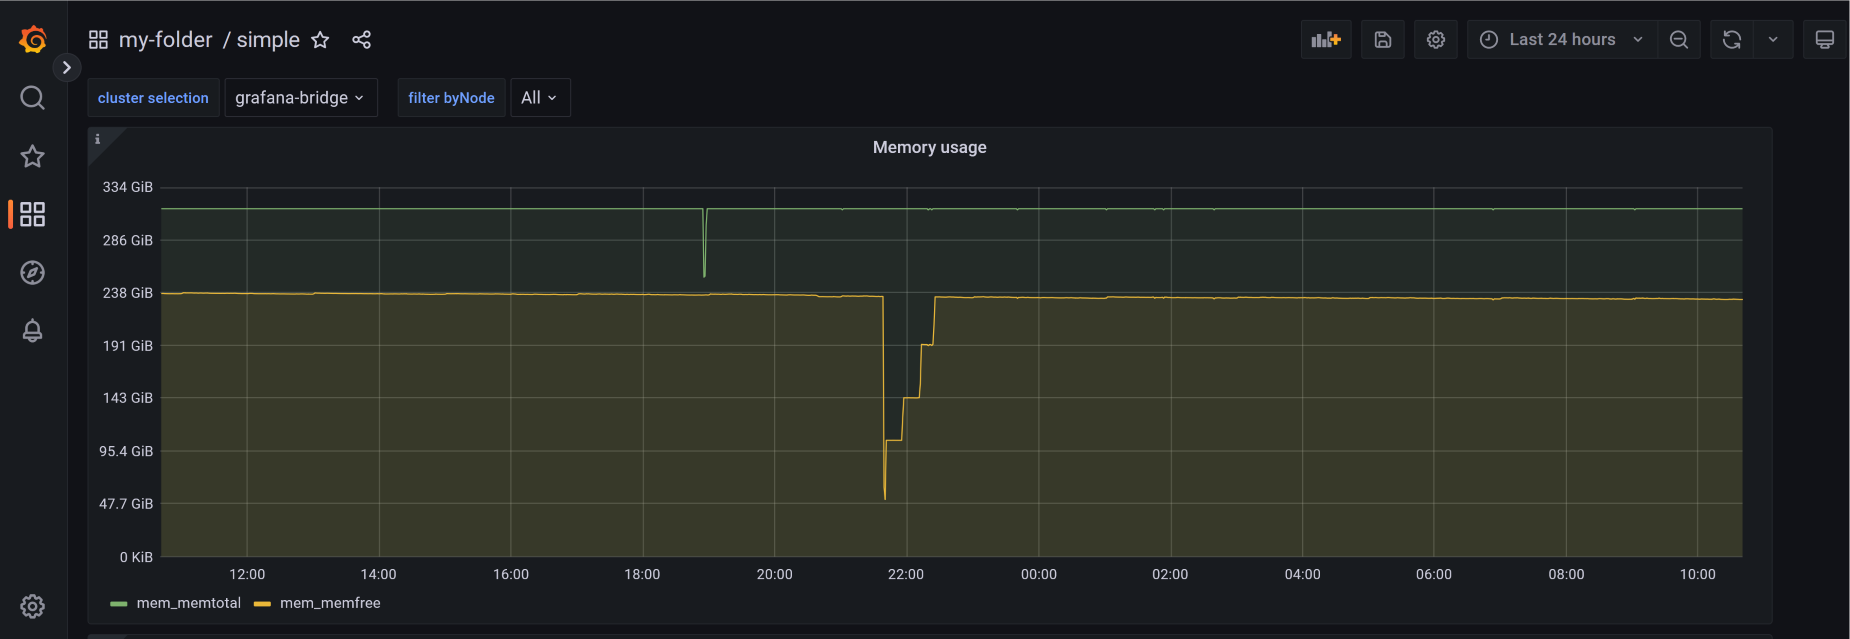
In the Grafana web interface sidebar, hover the cursor over Dashboards (squares) icon, and then click Manage. The simple dashboard is listed as member of the my-folder folder.
Click on the dashboard name (simple) to open this dashboard.
Visit the IBM Storage Scale Knowledge Center for getting more info about the latest product updates
-
- Setup classic Grafana
- Make usage of Grafana Provisioning feature
-
- Installing RedHat community-powered Grafana operator from OperatorHub
- Creating Grafana instance using the RedHat community-powered Grafana-operator
- Creating Grafana Datasorce instance from Custom Resource managed by the RedHat community powered Grafana operator
- Importing the predefined dashboard from the example dashboards collection
- Exploring Grafana WEB interface for CNSA project in a k8s OCP environment
- How to setup Grafana instance to monitor multiple IBM Storage Scale clusters running in a cloud or mixed environment
- API key authentication
- Configurable bridge settings
- CherryPy builtin HTTP server settings
- How to setup HTTPS(SSL) connection
- Start and stop grafana-bridge with systemd
- Grafana Dashboard Panel shows no metric values for a particular entity
- Missing Grafana-Operator on an OpenShift cluster
- Missing CherryPy packages
- What to do if your system is on Python < 3.8
- Grafana-bridge fails to start with Python3.8
- Grafana-bridge container time is different from a host time
- Verify that the grafana-bridge returns data as expected