In Circuit Debugging with Qt Creator
This page discusses how to use Qt Creator IDE to perform in-circuit-debugging of firmware running on radio microcontroller. With in-circuit-debugging (ICD), we can add breakpoints, step through code and inspect variable values, all for code running on physical radio. This is an advanced topic, requiring additional hardware debugger and also modifications to your radio, likely voiding warranty.
For successful ICD, some modifications to the radio are needed - please be aware that you will likely lose the warranty by doing so:
- either solder a connector to the radio mainboard STM32 Serial-Wire-Debug (SWD) header or solder directly wires to be able to hook up hardware debugger.
- it is highly recommend NOT to run ICD sessions when powered from battery, but from a power supply instead, so appropriate cable should be prepared.
- a modification to power circuitry is needed to force power power flow to the radio's main microcontroller, irrespective of the logical power control states. This step depends heavily on the radio and it's schematic. Although theoretically, you could apply power to MCU VDD rail externally, this might not be the healthiest choice for the existing power circuit.
The following example uses RadioMaster TX16S, please keep in mind that for other radios, the procedure can differ greatly.
The SWD header on RadioMaster TX16S is circled yellow:

The debugger needs to be connected to 4 lines:
- VTref - voltage reference sampling pin (to capture the required I/O voltage for SWDIO and SWCLK)
- SWDIO - Serial-Wire data (bidirectional)
- SWCLK - Serial-Wire clock (from hw-debugger to STM32 MCU)
- GND - reference potential
During ICD sessions, when you halt the execution flow of the EdgeTX firmware, you also halt the execution of low-battery voltage warnings and shut-off. For this, it is best to power the radio from an external power supply - be sure to take special care to match the polarity and voltage according to your radio. A debugging setup with a lab power supply, can be setup for example as in the following picture:

The modification to force the power flow also during debugging resets is not for the faint of heart. The following picture displays a close-up of the position where a grounding wire can be tapped on RadioMaster TX16S to continously keep the power circuit active, irrespective of the power button:

A nicety, in order not to have the inactivity alarm sounded in longer debugging sessions, where the code is not stopped, is to disable the inactivity alarm in the radio settings. For this, open radio\src\firmware\Source Files\opentx.cpp and change g_eeGeneral.inactivityTimer in function generalDefault() from default value 10 to 0 (0 means disabled).
This code change gets applied only for fresh settings, meaning if there is no RADIO24\radio.bin on the microSD-card yet. If your radio is already setup with the current microSD card, navigate in the radio SYSTEM -> RADIO SETUP -> Alarms -> Inactivity and set here the value to 0minutes as well.
The following assumes, you followed the instructions in Building and debugging with Qt Creator to setup Qt Creator and the previously mentioned modification to power circuit was carried out.
Lets start by setting a breakpoint at the beginning of the code. In Mode Selector select Edit. Unfold OpenTX [2.4] and open opentx.cpp under radio -> src -> firmware -> Source Files. Locate function main() (tip: you can use the find function with CTRL+F) and put a breakpoint by clicking at the front of a line number before function call to boardInit()

Power your radio with external power supply and hook up your hardware debugger to the SWD header. In Qt Creator, press the green play button with a bug icon in the lower left of Qt Creator menu. After some moments, if everything went smoothly, the code should start and the execution pointer (yellow arrow pointing at the next instruction to be executed) remains at boardInit() waiting for your further instructions.
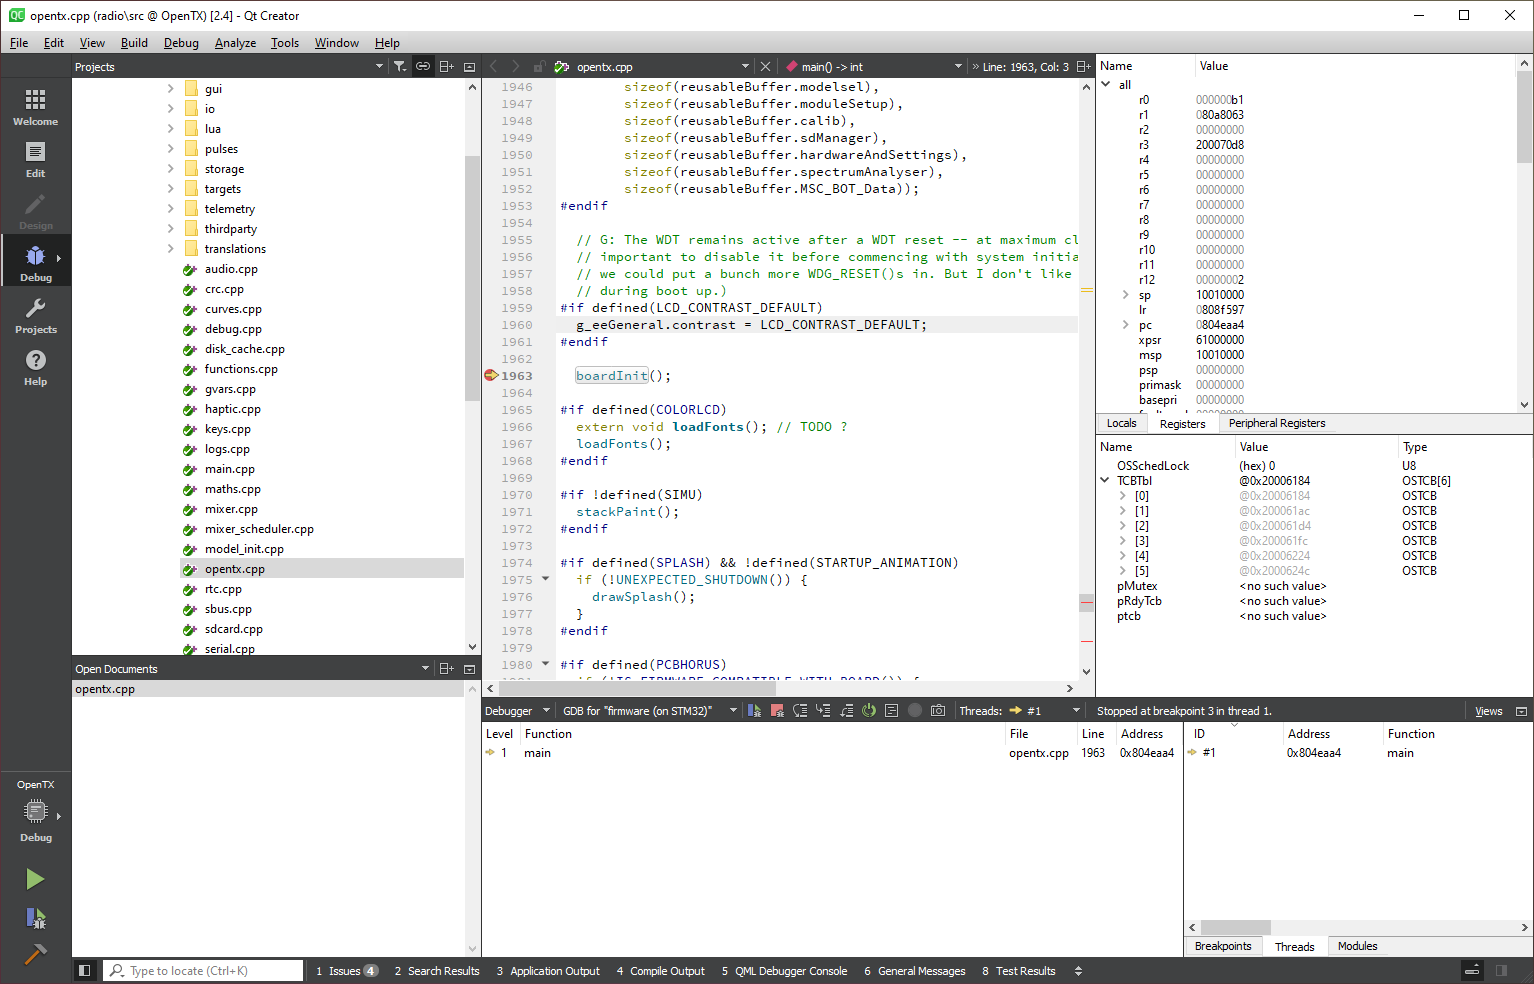
You can step through code, add additional breakpoints, inspect variables, or just let the code run and then pause it to see where it is at the moment of your press.
To stop debugging, hit the red stop button or select from menu Debug -> Stop Debugger.