Using the Debugger via VSCode
Do you want to go beyond the "add a print statement, recompile, and re-run the program" loop when it comes to debugging your programs? If so, interactive debuggers are the answer for you! Interactive debuggers allow you to see exactly what's going on inside your program without recompiling your project, adding extra source code, or leaving your IDE. You can add breakpoints to your program that magically pause your program when it reaches that line. You can then inspect the value of every variable, look at the call stack, and control the execution by stepping through the subsequent instructions.
This is super helpful when you want to figure out exactly why your program is crashing on a particular source code line. Now you can add a breakpoint at that particular line (or just before it) and see what's happening: E.g., you can take a look and see if some of your variables contain values that they shouldn't and work your way backwards through the program to figure out where the corruption took place.
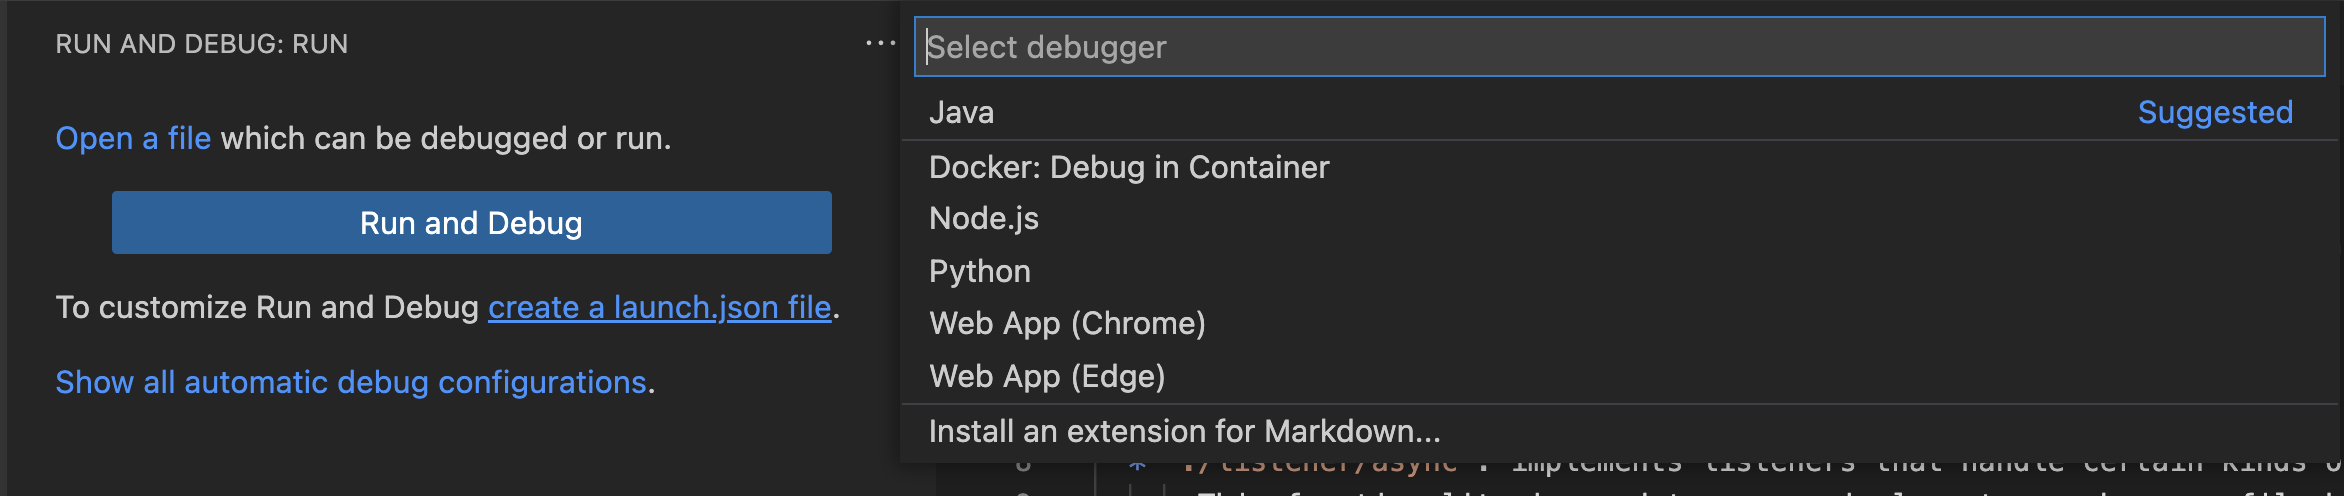
To begin with, go to the "Run and Debug" tab in VSCode and click on "create a launch.json file", as shown below.

When asked to select a debugger, choose the Java option from the dropdown menu:
After selecting the Java option, VSCode should create a launch.json file for you, located in a .vscode directory at the root of your project. The contents of that file will then be displayed on in your editor:
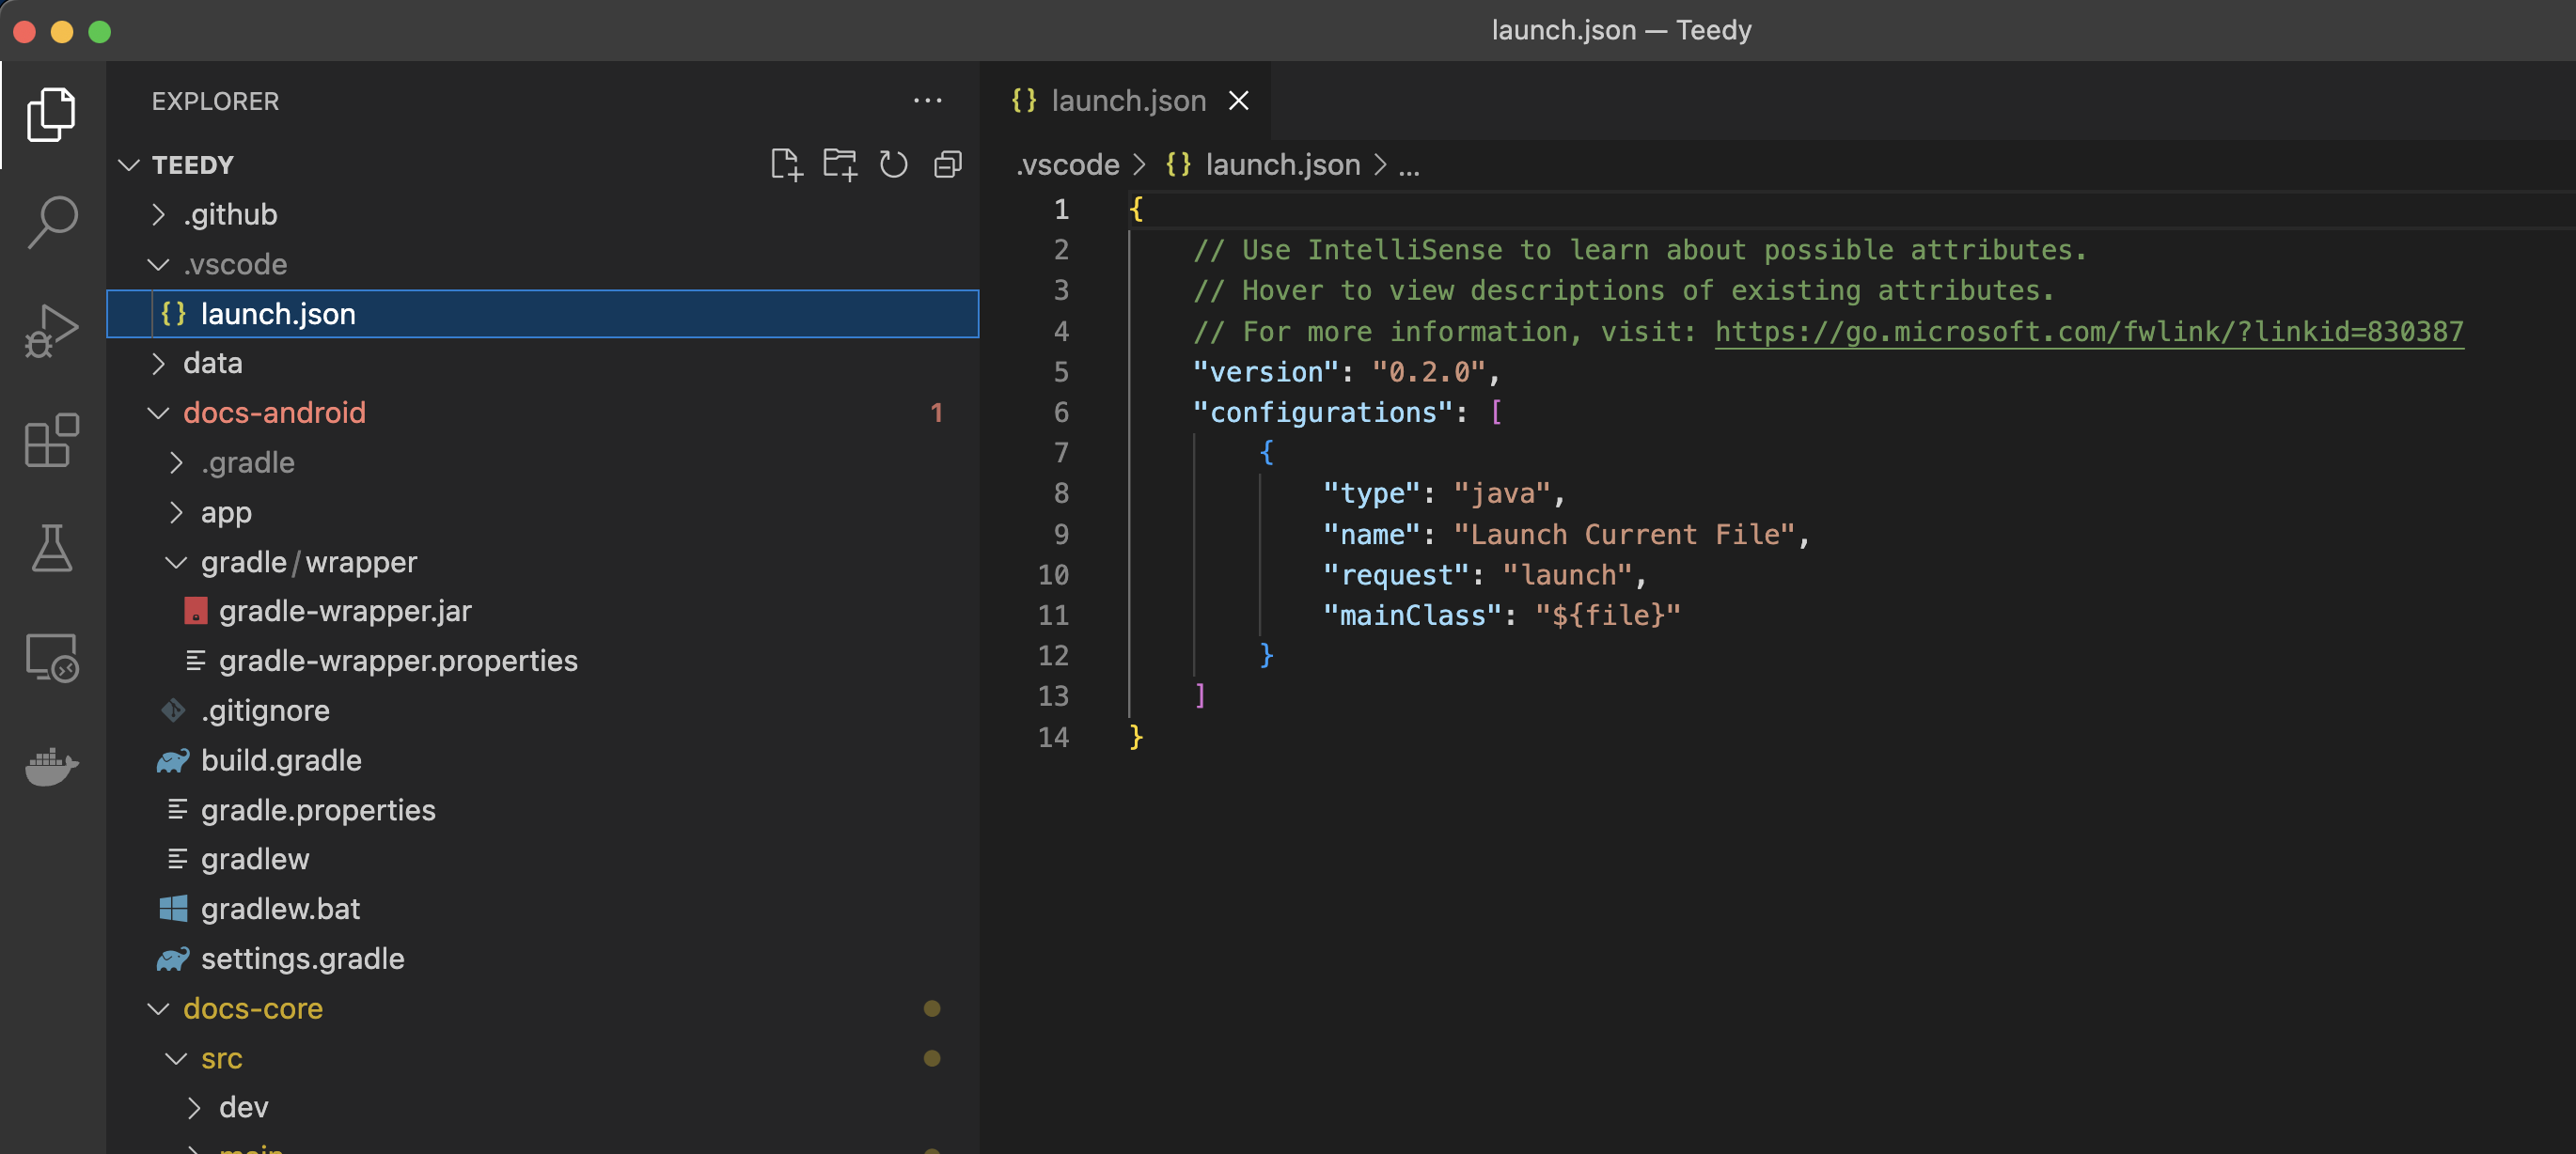
At this point, the debugger will not work as intended with your project: The default Java debugger is intended for traditional Java applications with a standard static void main entrypoint. For Teedy however, the application is launched inside of a Jetty web server (via mvn jetty:run that is managed by Maven. To allow our more complex application to be debugged, we will change our launch.json configuration to instruct VSCode to connect to a remote debugger running on port 8000. To do so, you can change the contents of your launch.json to those given below:
{
  "version": "0.2.0",
  "configurations": [
    {
      "type": "java",
      "name": "Debug (Attach)",
      "request": "attach",
      "hostName": "localhost",
      "projectName": "com.sismics.teedy",
      "port": 8000
    }
  ]
}To use the debugger you will use mvnDebug rather than mvn to run your commands. For example, to launch Teedy you will execute:
$ mvnDebug jetty:run
Preparing to execute Maven in debug mode
Listening for transport dt_socket at address: 8000
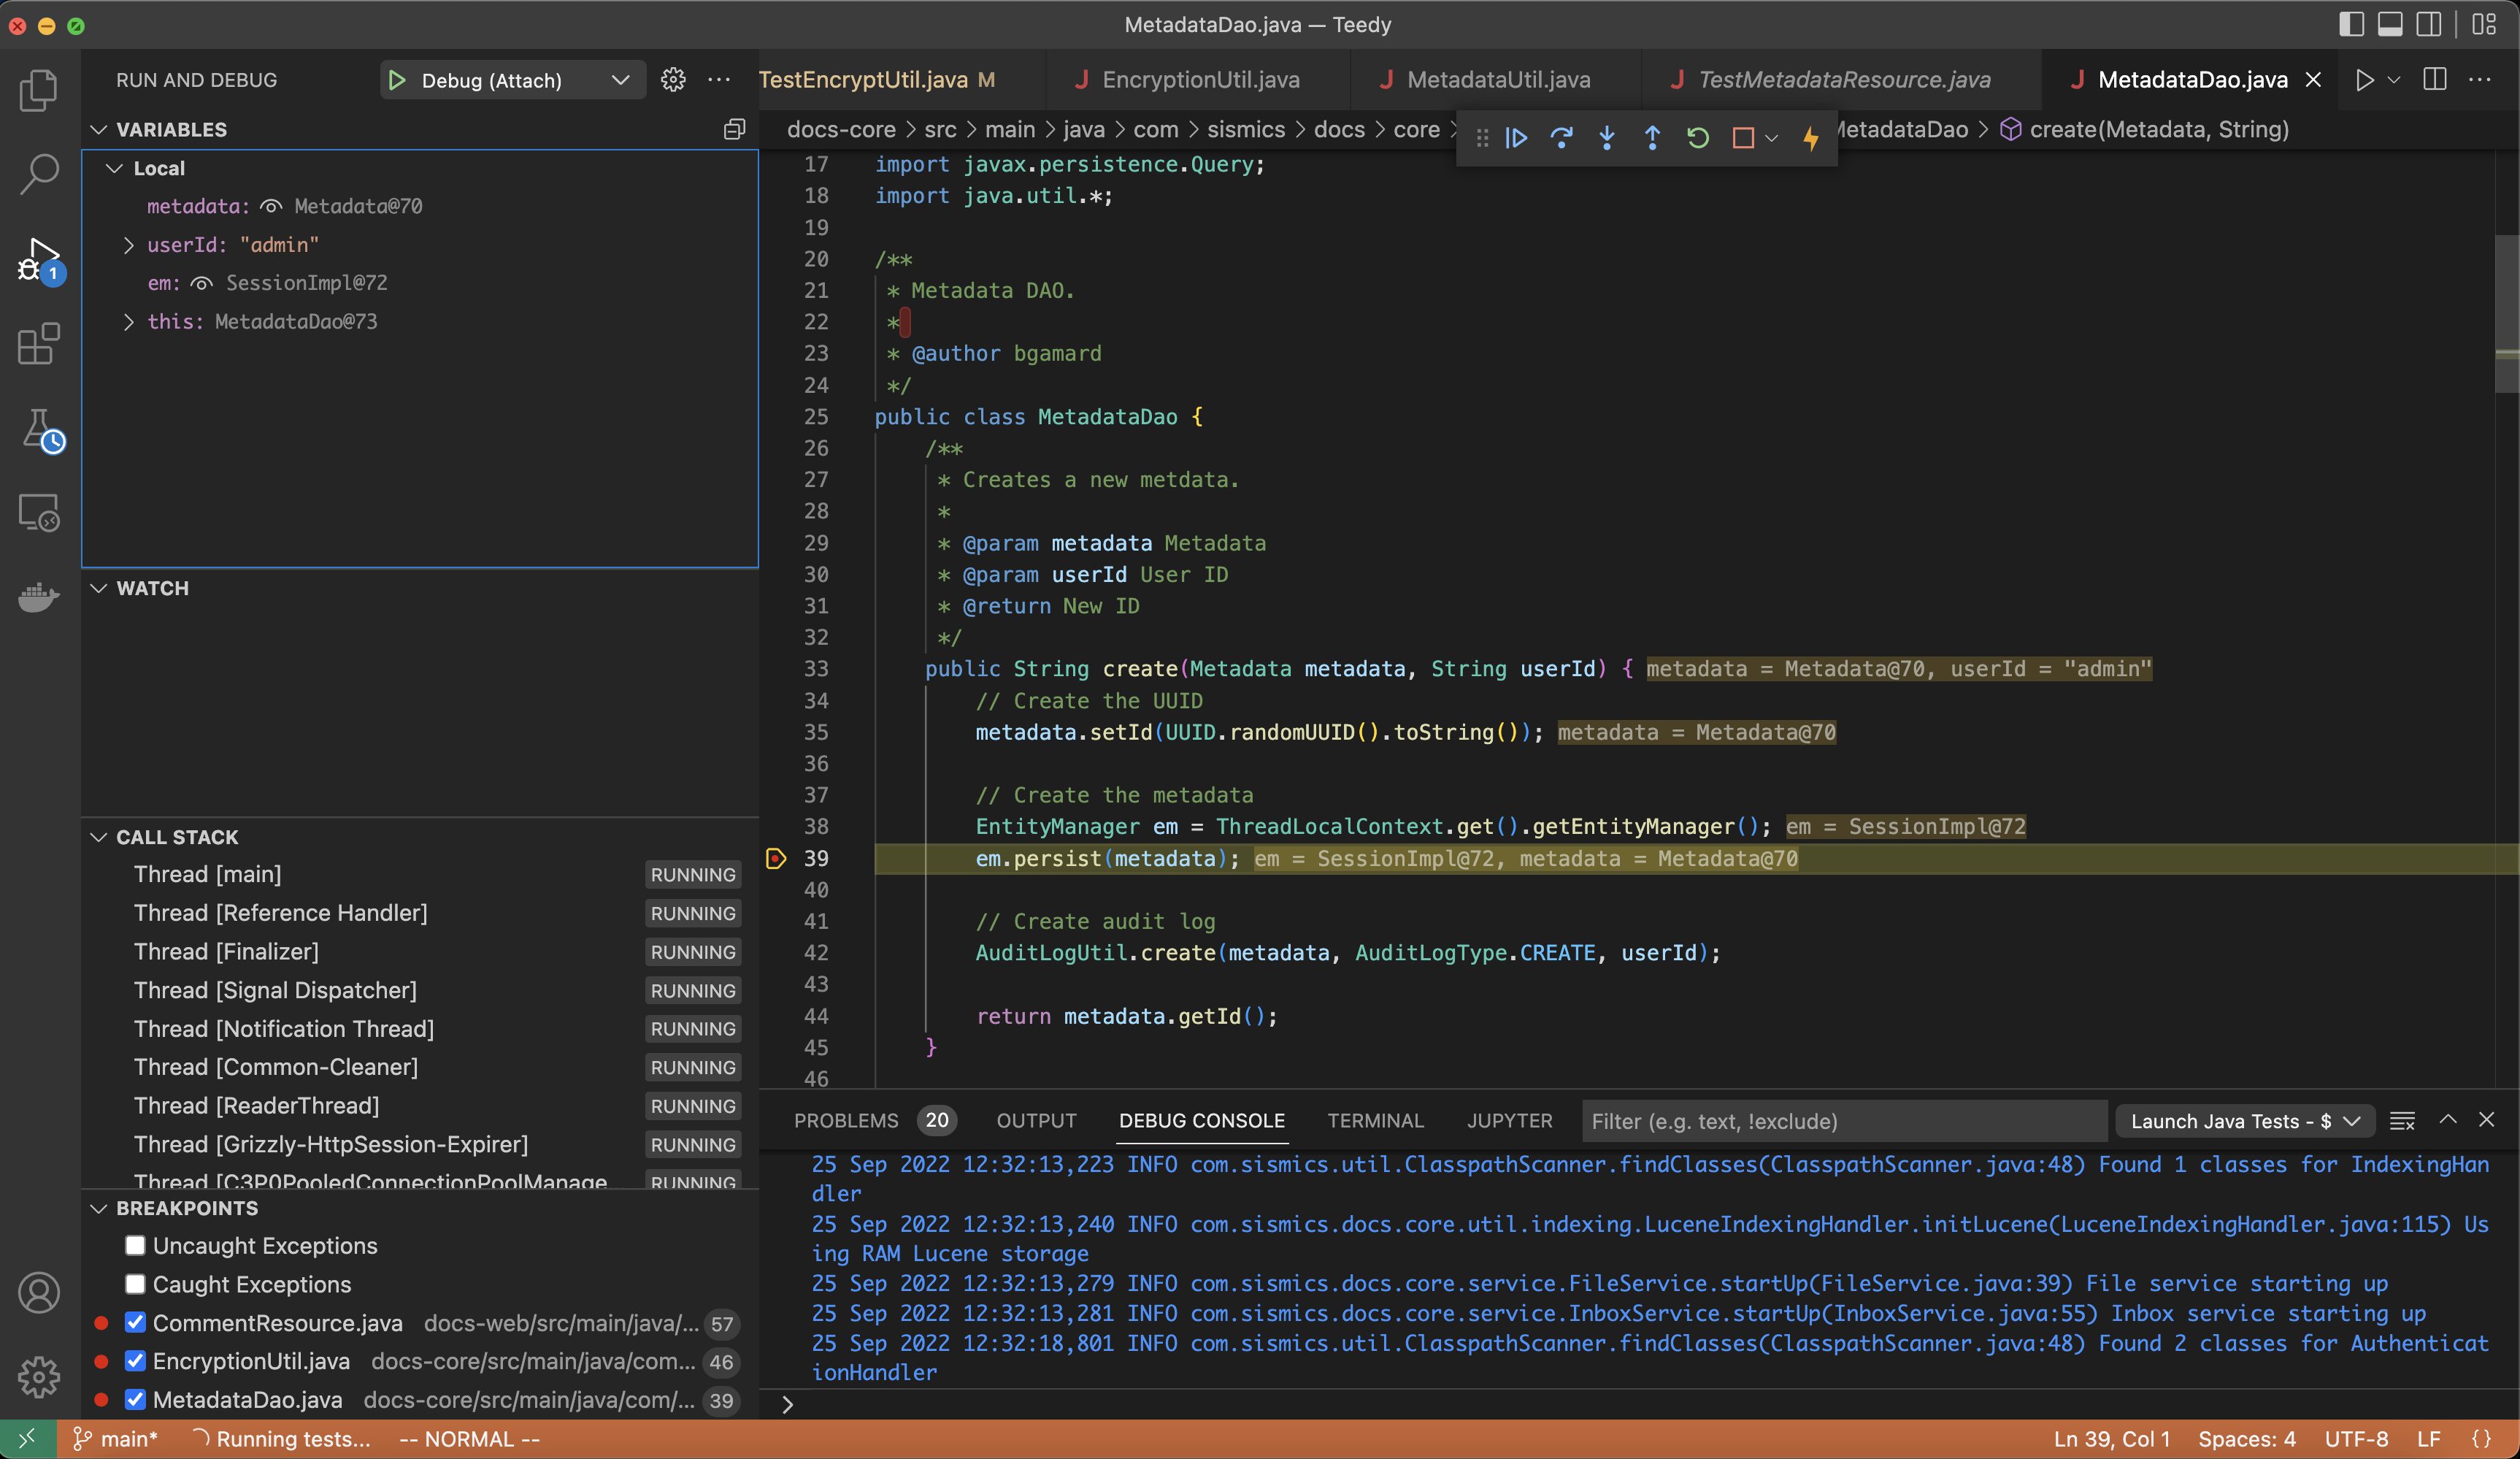
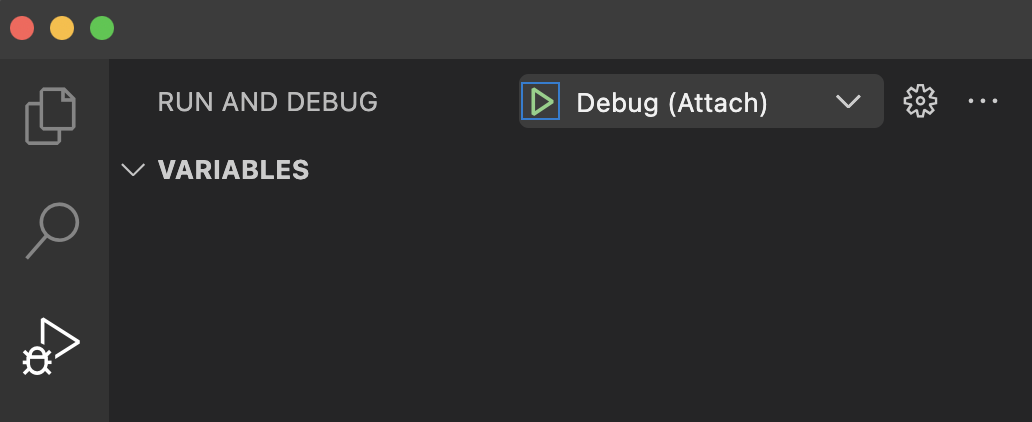
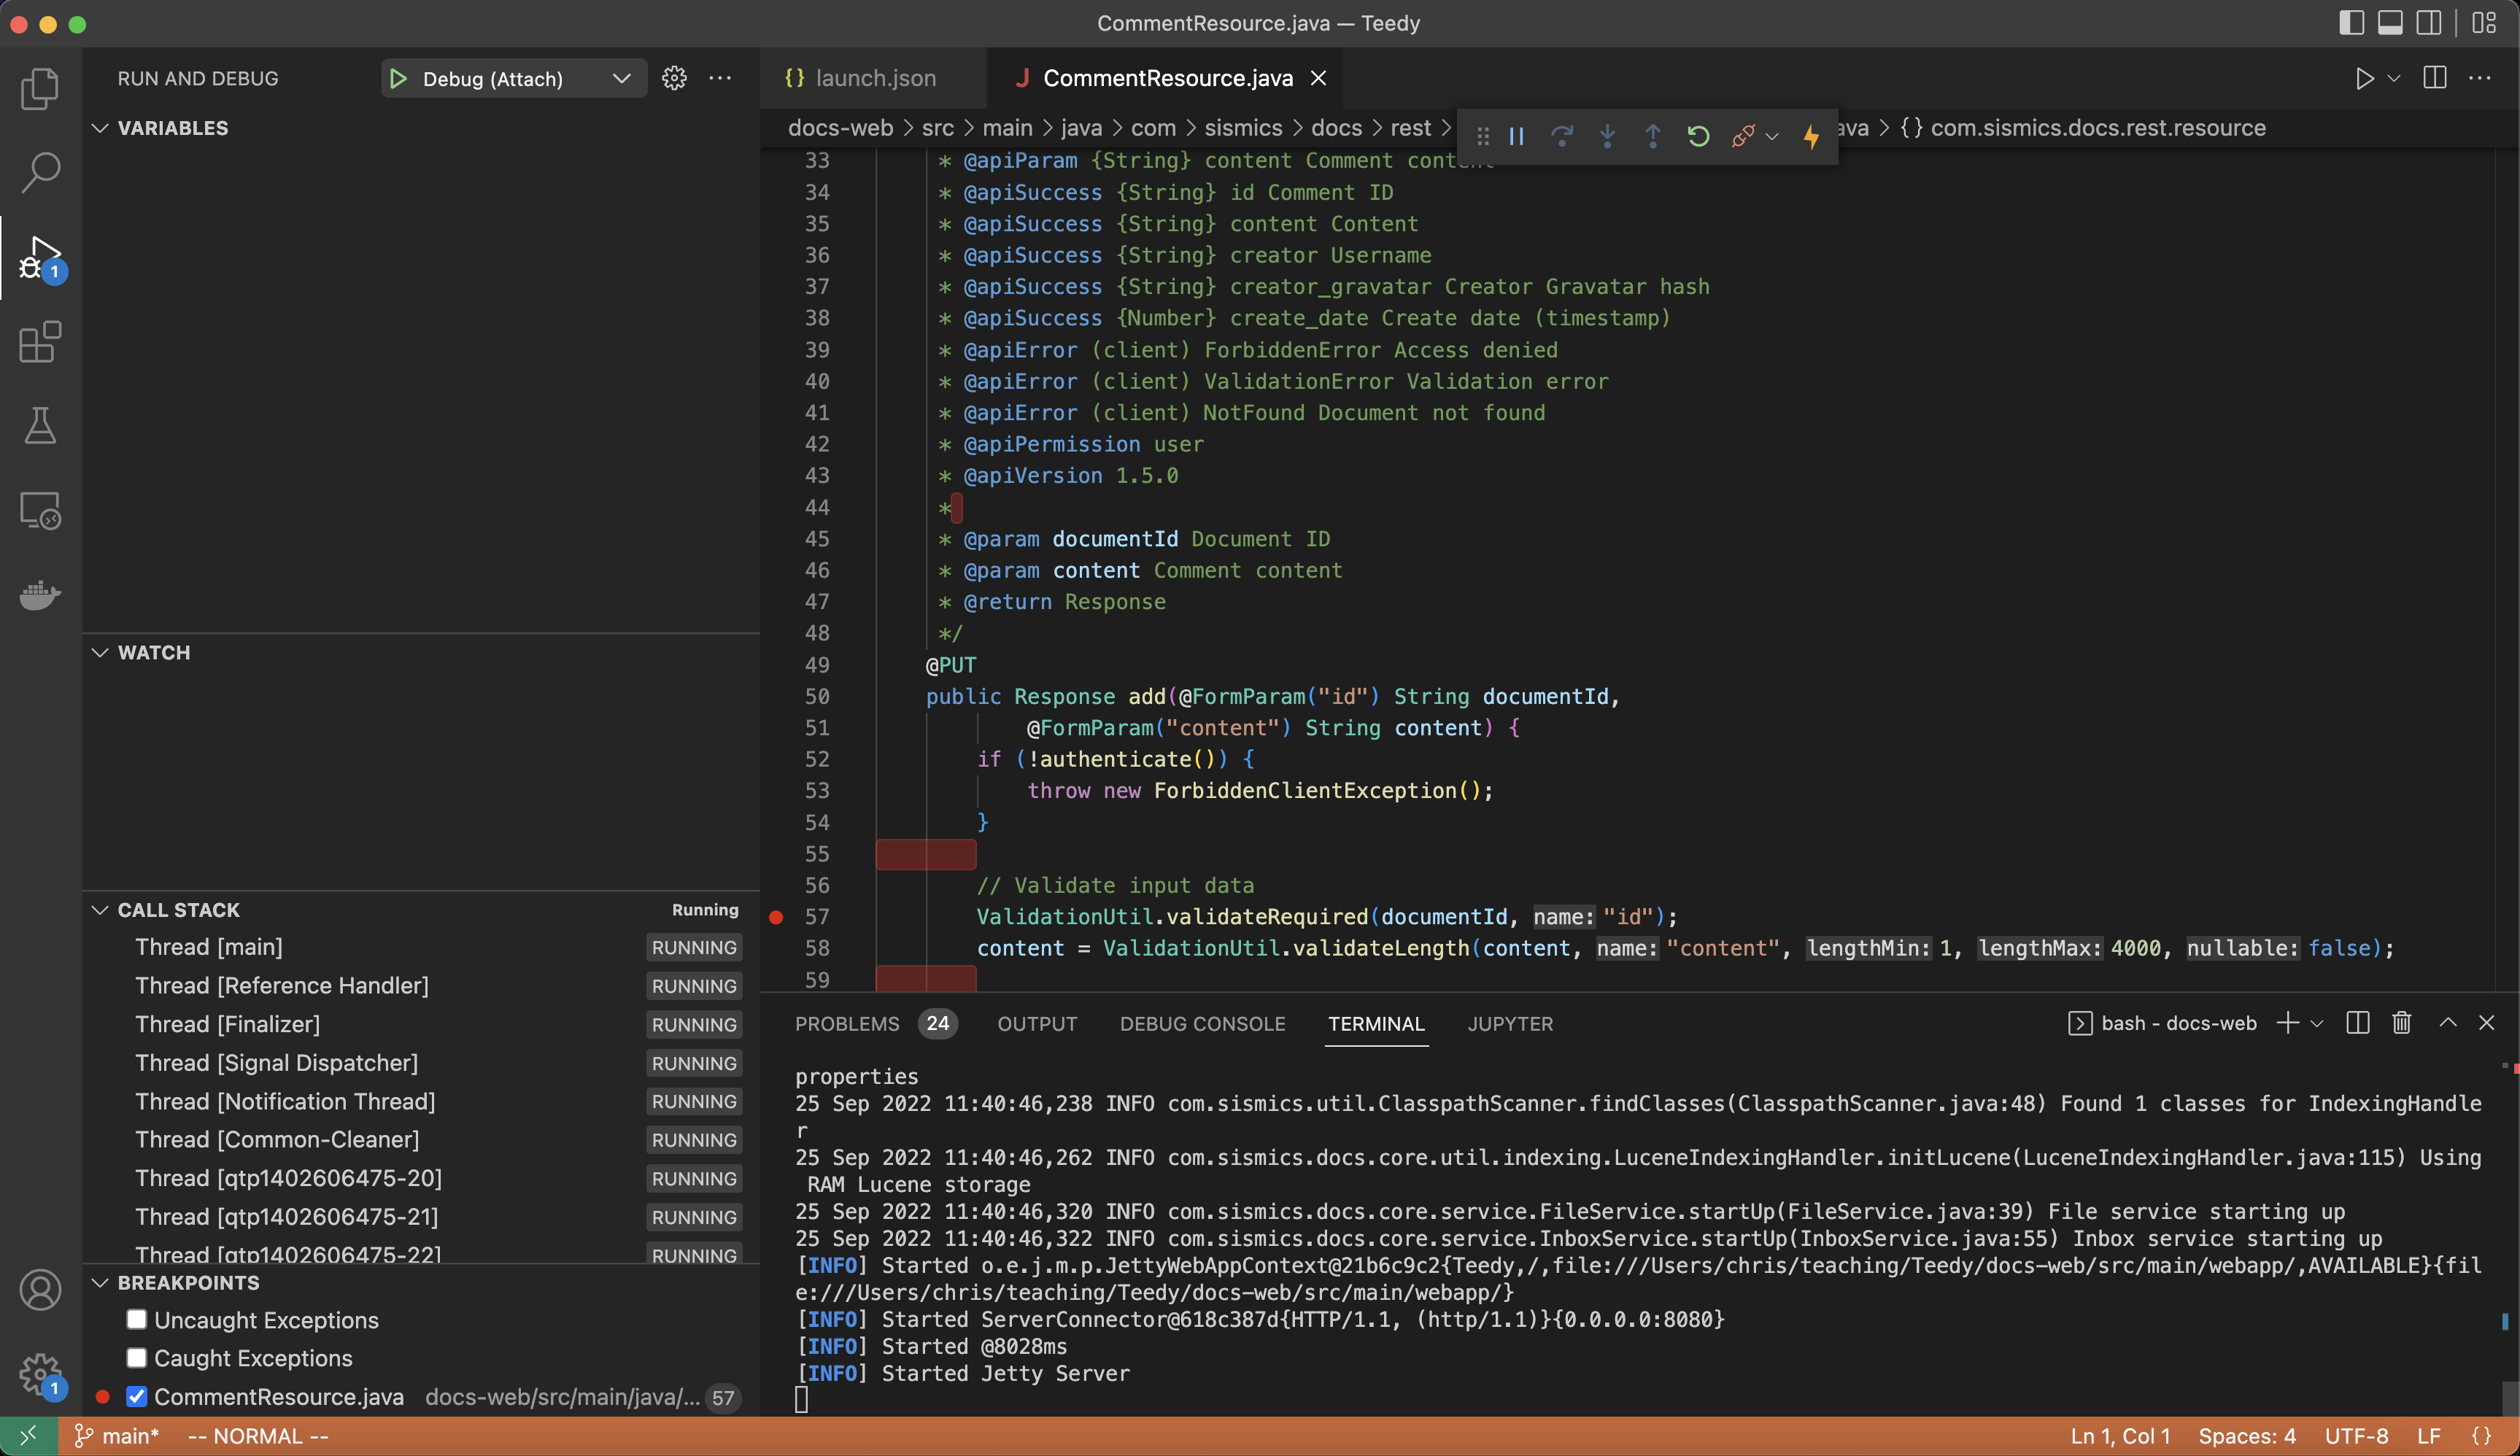
Executing the above command will launch a remote debugger on port 8000. At this point, the application won't launch until a connection has been made to the remote debugger. We can now connect VSCode to the remote debugger by navigating to the "Run and Debug" panel and hitting the play button.
After attaching to the debugger, the Jetty server will resume the launch process and you will now be able to inspect and debug the state of the running application.
You can also use the debugger when running individual test cases. The least preferable way to run tests is by executing mvnDebug test from the command line (and using the -Dtest option to run a specific test).
A much better alternative is to run your tests via the IDE. To do so, you can go to the Testing tab in VSCode (indicated by the beaker), as shown below.
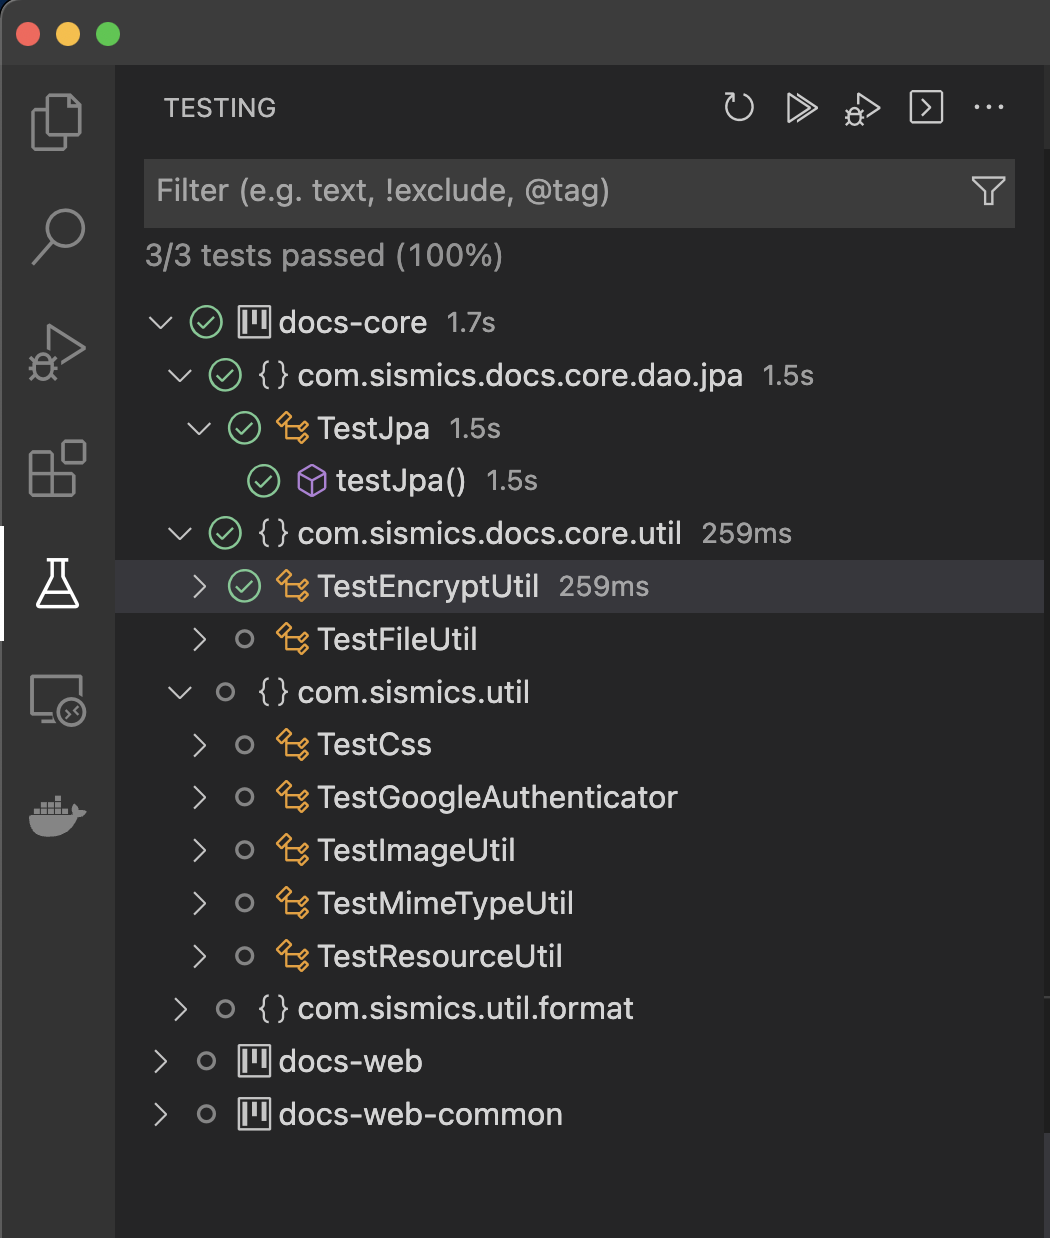
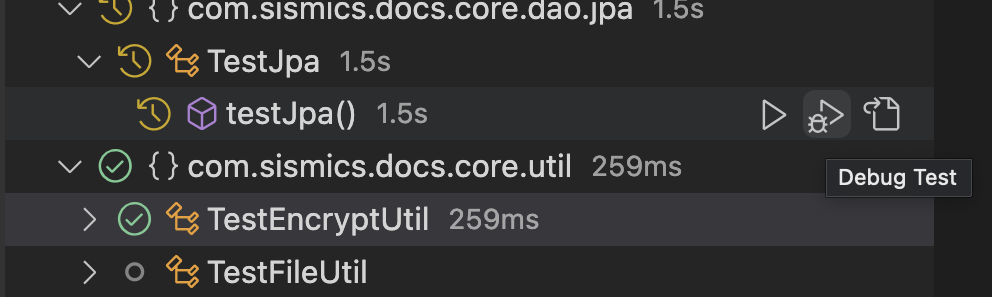
You can then navigate through the test cases within each of the projects inside the repository (i.e., docs-core, docs-web, docs-web-common) and execute individual test cases by using either the run or debug buttons as shown in the image below.
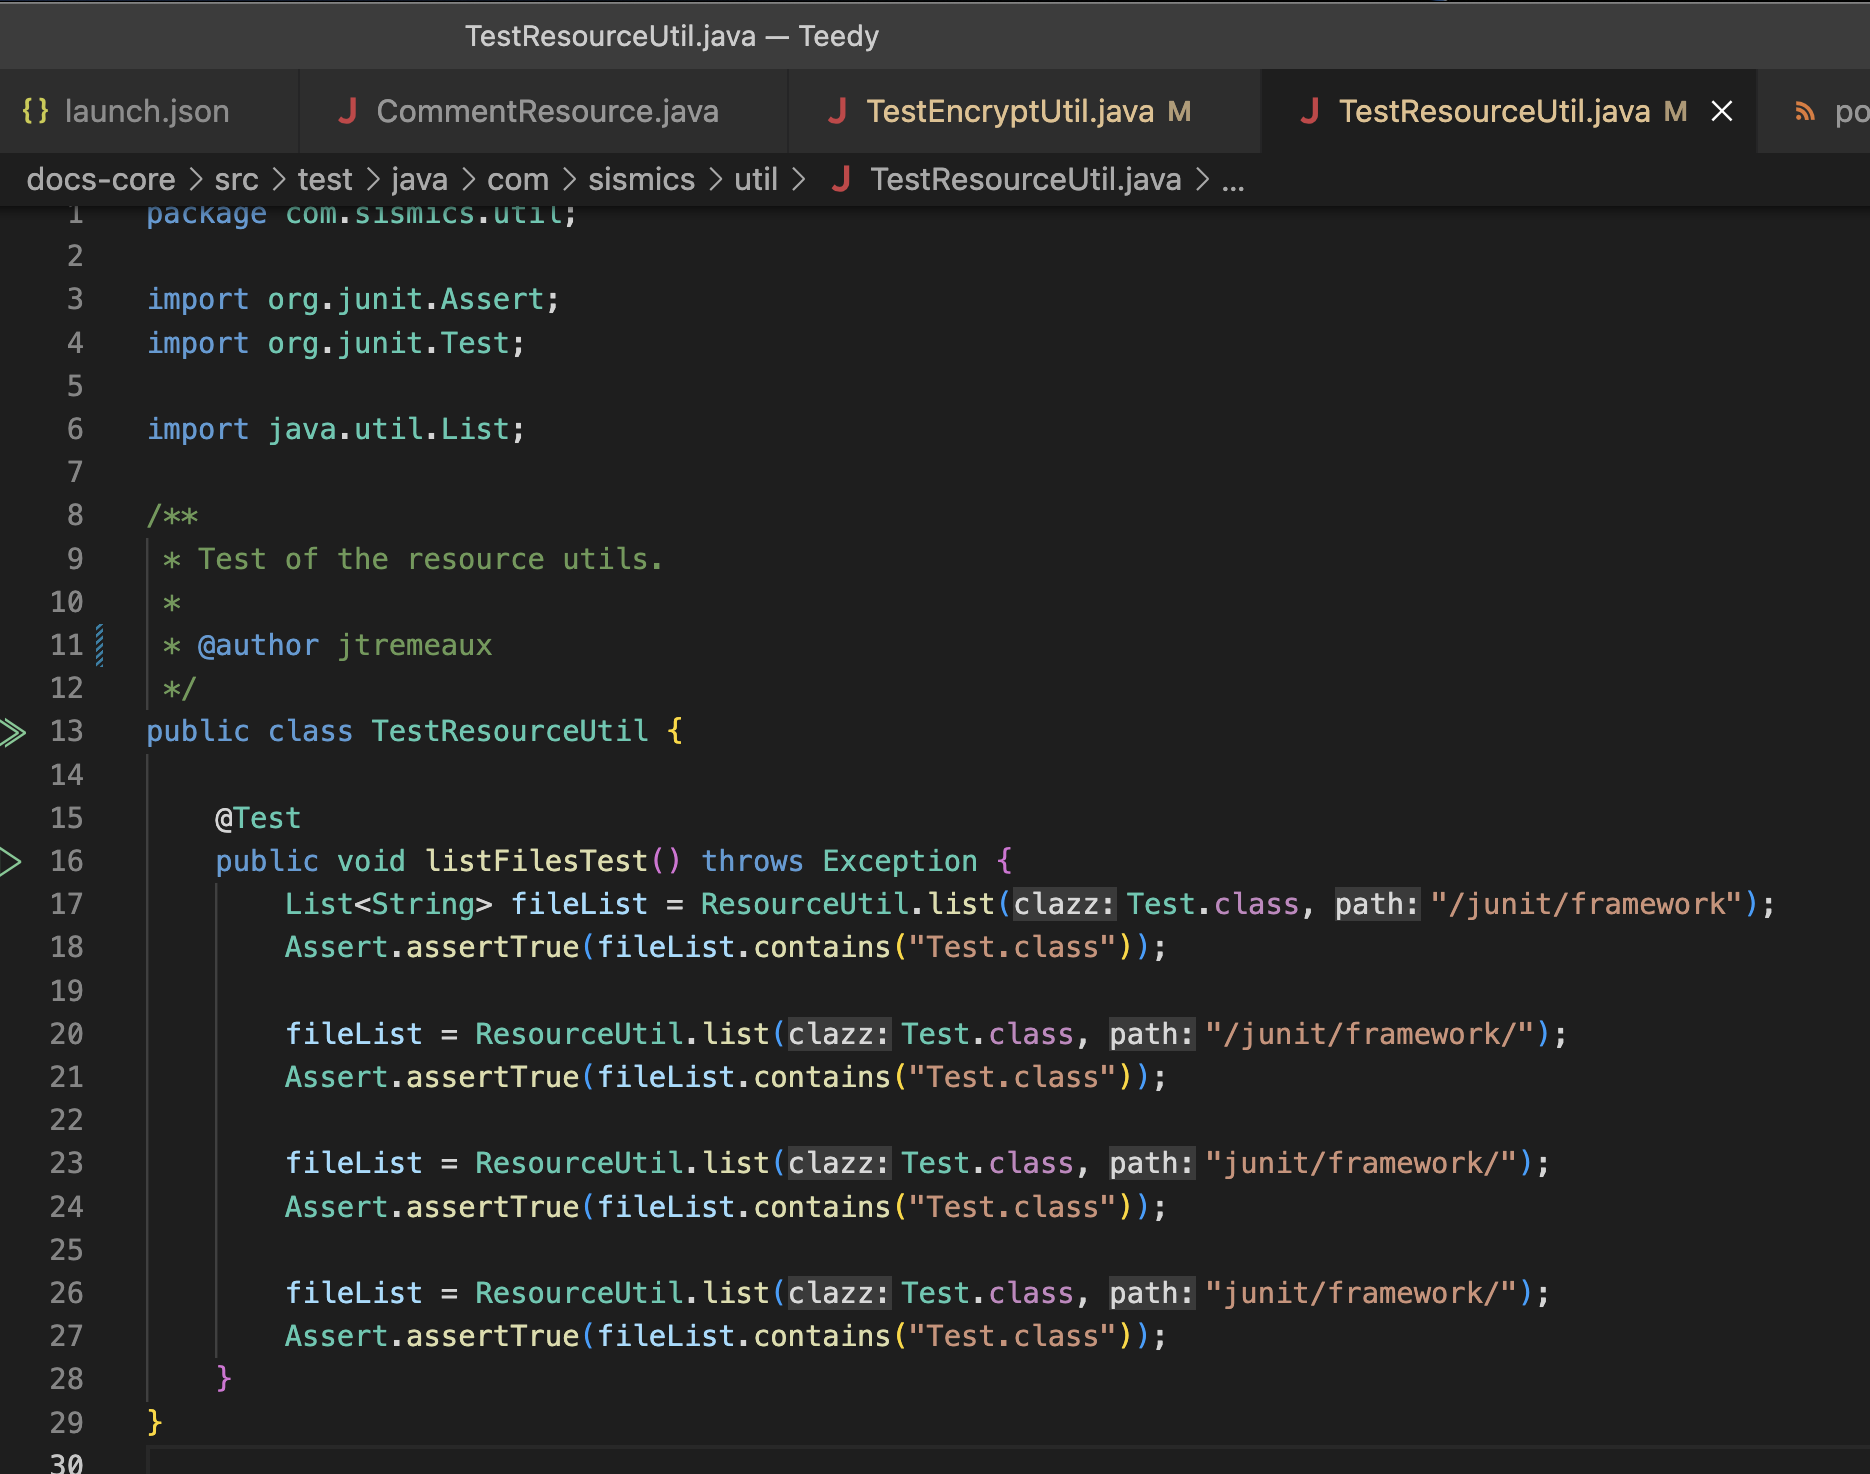
Alternatively, you can go to the source code for a particular test case and right click on the play button next to each test to debug an individual test:
Note if you try to run the test cases for Teedy in this way, you will most likely encounter the following error message in the Problems tab:
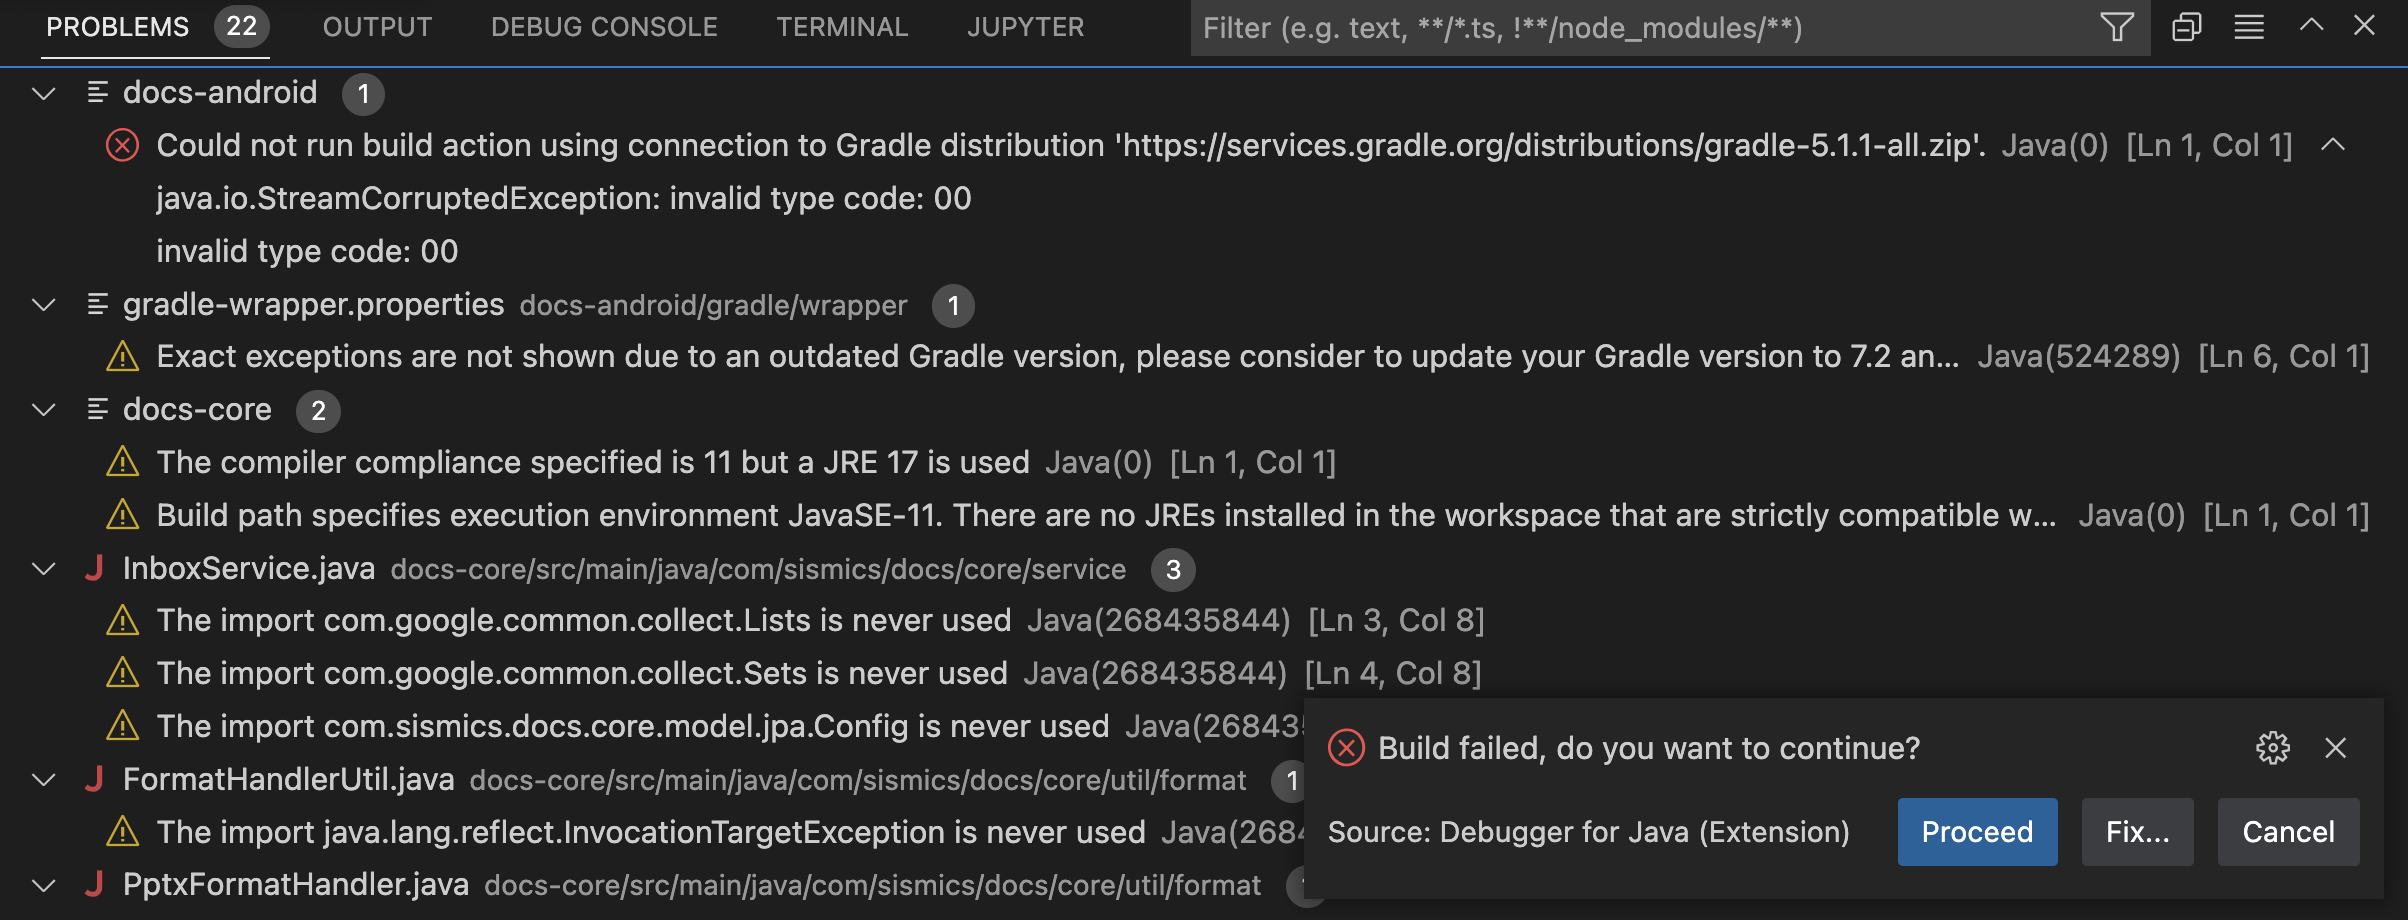
This build error is caused by a very outdated docs-android project. Since we will not interact with the Android app for Teedy in this class, you should not attempt to fix the underlying problem. Instead, you can either (a) simply hit the "Proceed" button in the pop-up message to ignore the build failure in docs-android, or, better yet, (b) delete the docs-android project from your repository.