Grafana panel for displaying metric sensitive SVG images using the snap svg library (http://snapsvg.io/).
You need the latest grafana build for Grafana 3.0 to enable plugin support. You can get it here : http://grafana.org/download/builds.html
It is possible to clone this repo directly into your plugins directory.
Afterwards restart grafana-server and the plugin should be automatically detected and used.
npm install
grunt
sudo service grafana-server restart
If the plugin is cloned to a directory that is not the default plugins directory then you need to edit your grafana.ini config file (Default location is at /etc/grafana/grafana.ini) and add this:
[plugin.svg]
path = /home/your/clone/dir/svg-panel
Note that if you clone it into the grafana plugins directory you do not need to add the above config option. That is only if you want to place the plugin in a directory outside the standard plugins directory. Be aware that grafana-server needs read access to the directory.
To add your own custom SVG graphics you have to fork the original project and add them to the assets folder. If your repository is of general concern and your license allows sharing you can also add it to the panel plugin via pull request on github
paste your svg code here. Don't forget to include a viewbox and IDs for all relevant objects.
Note: You cannot use SVG Data editor together with the use SVG Builder option checked!
For a start check out the Demo-SVGs provided with the panel plugin. To load them go to the bottom of the options page and click the corresponding button
this code is execute upon every Rerfresh
onHandleMetric(ctrl: MetricsPanelCtrl, svgnode: HTMLElement)
ctrl passes a grafana MetricsPanelCtrl object. This object contains all relevant data pertainig the current panel.
You may want to use the ctrl.data array property to access the current measurement data.
svgnode passes the HTMLElement of the svg object on the panel. You can access the elements of the svg itself by using the integrated Snap Library. (http://snapsvg.io/)
var s = Snap(svgnode);
s.select('#status')
this event is executed once, right after the first initializiation of the SVG.
onHandleMetric(ctrl: MetricsPanelCtrl, svgnode: HTMLElement)
ctrl passes a grafana MetricsPanelCtrl object. This object contains all relevant data pertainig the current panel.
You may want to use the ctrl.data array property to access the current measurement data.
svgnode passes the HTMLElement of the svg object on the panel. You can access the elements of the svg itself by using the integrated Snap Library. (http://snapsvg.io/)
var s = Snap(svgnode);
s.select('#status')
- fixed rendering of SVG which are higher than wide
- Package update due to security vulnerabilities.
- Implemented support for data in docs type. (e.g. Elasticsearch Raw Document) Thanks to Zoltán Szabó (https://github.com/zoell)
- The data passed to the panel is now stored in the
ctrl.dataproperty. The alias propertyctrl.seriesshould not be used anymore and is to be regarded deprecated.
- Implemented support for data in table format. Thanks to Lauri Saurus (https://github.com/saurla)
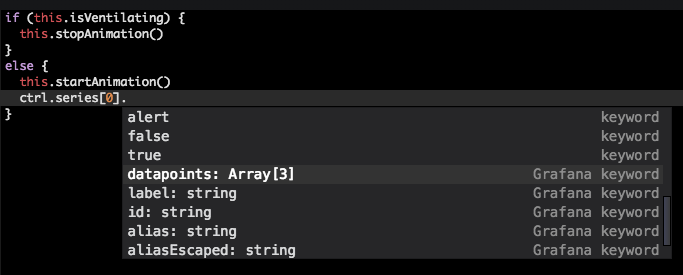
- now includes JavaScript code completion for the objects this, ctrl and svgnode.
- BREAKING: plugin was renamed marcuscalidus-svg-panel in line with http://docs.grafana.org/plugins/developing/code-styleguide/
- export dashboard containing grafana-svg-panel as json
- install marcuscalidus-svg-panel plugin. Either by cloning it into separate folder (=safe method) or by pulling it into the current version.
- replace all occurrences of grafana-svg-panel with marcuscalidus-svg-panel in the json file.
- reimport the json to overwrite the existing dashboard
- ace editor for code editing
- panel now runs smoothly in IE11 (added necessary polyfill)
- fixed bug with onInit function in Grafana 5
- new method for injecting SVG via Snap svg library
- added SVG Builder
- Initial build


