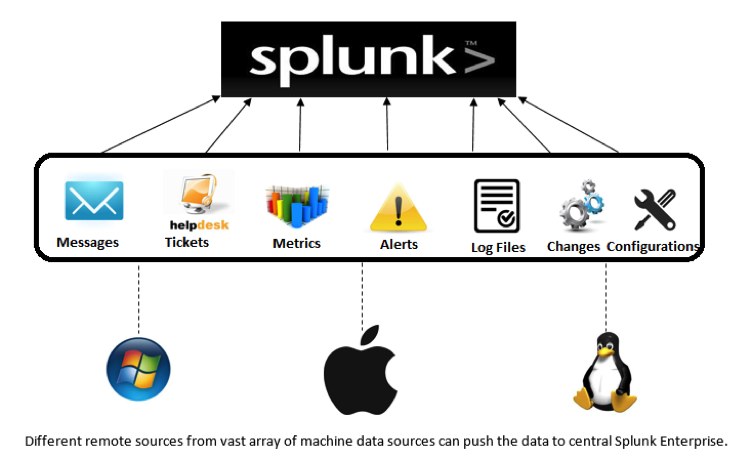
Splunk is a way to aggregate, analyze, and get answers from Machine Data
5 Main functions:
- Index Data
- Search and Ivnestigate
- Add Knowledge
- Monitor & Alert
- Report & Analyze
App management, Operations Management, Security & Compliance, and everything else. Single Pane of Glass
- Machine data is anything that is generated by a device and stored in some form of log.
- 90% of data accumulated by organizations;
- Structured and unstructured data;
- can be very hard to process due to this.
- Big Data types of issues
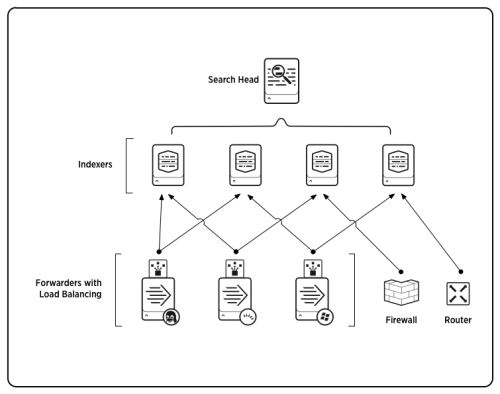
- Splunk Search Head:
- Allow user to use the Search language
- Distribute user search requests to indexers
- consolidates results and extracts field value pairs
- Knowledge Objects on the search heads can be created to extract new fields or transform the data
- Provide toolds to enchance the search experience such as reports, dashsboards, and visualizations
- Splunk Indexer:
- Process machine data stores results indexed as events, enabling fast search and analysis
- creates a number of file organized in directories by age ( of compressed raw data and pointers to it )
- Splunk Forwarders:
- Enterprise instances that consume and send data to the index
- Require minimal resources and have liitle performance overhead
- Typically reside on machines where data originates
- Primary way data is supplied
- Deployment Servers:
- Single Server, testing proof of concept
- Cluseter Masters
- I can cluster each component
- License Master
- in the Enterprise: installed and adminstered on site
- in the Cloud: Scalable Service with no infrastructure required
- Splunk Light: Small IT Environment
- Desinged to address a wide variety of use cases and to extend the power of splunk
- Collections of files containing data inputs, UI elements, and/or knowledge objects
- Allow multiple workspace for different use cases/user roles to co-exist on a single splunk instance
- 1000+ ready-made apps
IT Service Intel -> monitoring for analytics and OPS Splunk Enterprise Security -> Comprehensive Securtiy Informtaion and Event Management Splunk User Behavior Analysis -> finds know and unknown and hidden threats analyzing user behavior
3 main roles: * Admin * Power * User
- roles control everything, admin can create new roles
| rest /services/authentication/users | mvexpand roles | table realname, title, roles, email | join roles [ rest /services/authorization/roles | rename title as roles | search srchIndexesAllowed=* | table roles srchIndexesAllowed]
Download the file through the web portal or the wget -O CLI tool

- Computers
- Network devices
- VMs
- Internet devices
- Com devices
- sensors
- databases
- logs
- configs
- messages
- call detail records
- clickstream
- alerts
- metrics
- scripts
- changes
- tickets
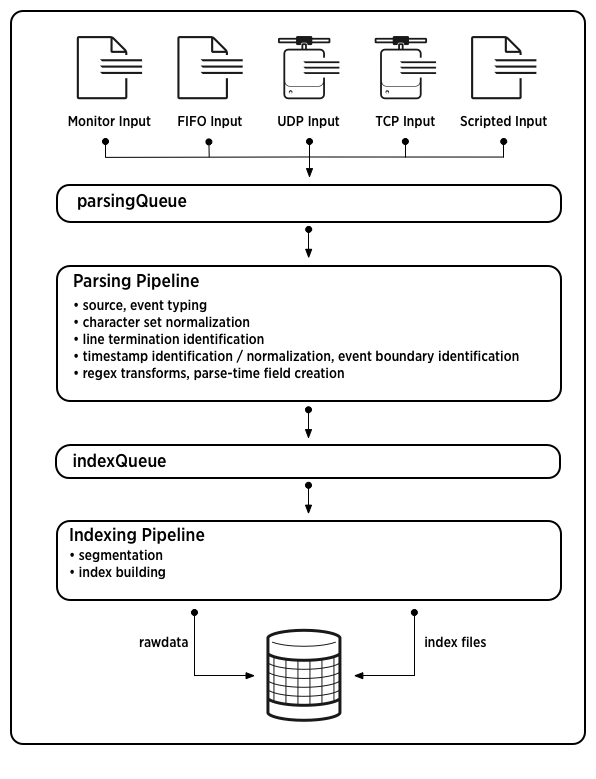
- Input Phase: handled at the source
- Parsing Phase: handled by indexers
- Indexing Phase: license meter run, after write, cannot be changed.
- Files and Directories: monitoring text files and/or dir structures of text files
- Network Data: listeing on a port for network data
- Script Output:executing a sript andusing the output from it as input
- Windows Logs: event logs, Active Directory, etc
- HTTP: HTTP Event Collector
- and more
- Add Data Inputs with:
- Splunkbase apps
- Splunk WEb
- Cli
- edit
inputs.conf
- Default MetaData Setting:
- Source: path of input file, network hostname:port, or script name
- host: Splunk hostname of input instance (forwarder)
- sourcetype: source filename if not automatically determined
- index: default of main
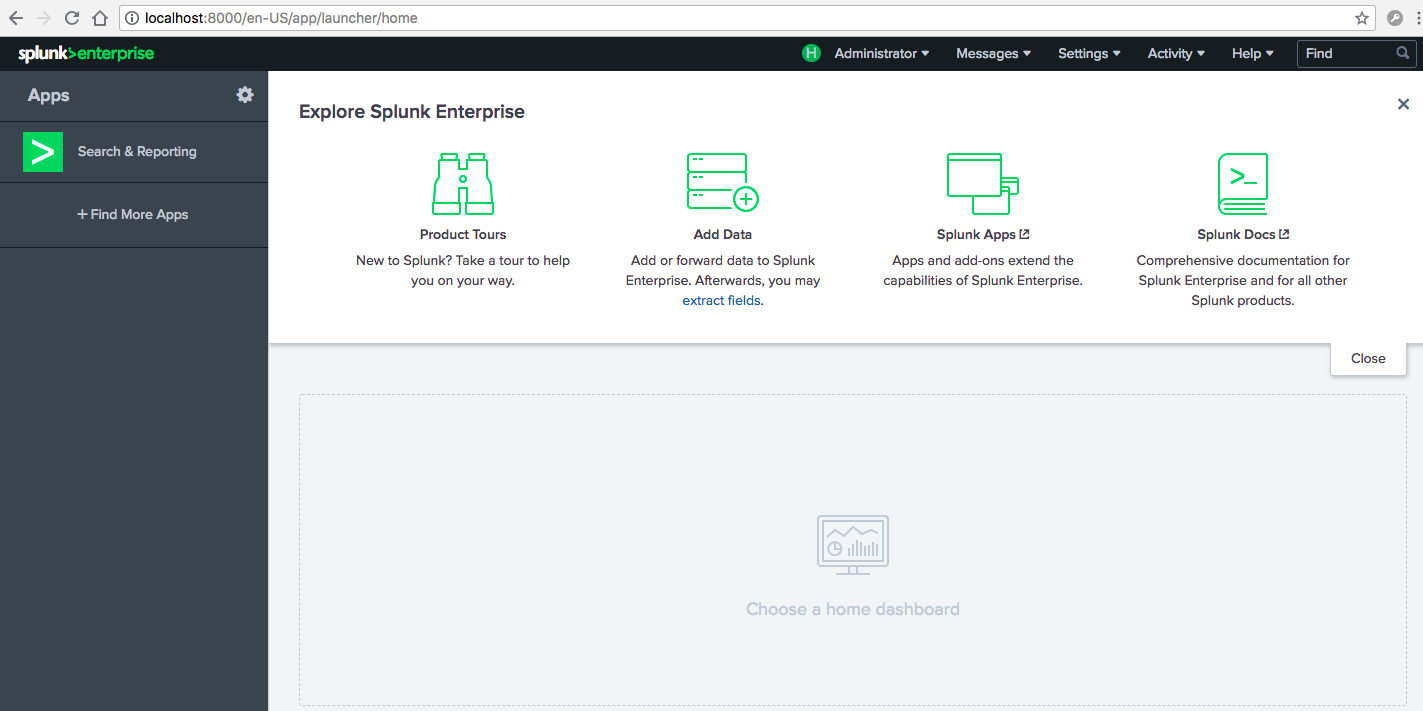
- Admins can click the Add Data icon and run through the wizard on the Home page or the Settings panel
- Upload allows only uploading of local files that get indexed once. Does not create
inputs.confand it never updated. - Monitor Proives one-time or continuos monitoring of files, directories, http events, network ports, or data gatehring scripts on Enterprise instances
- Forward Main source of input in production environments, comes from remote machines that gather and pass it along
- The wizard will walk you through the main componenets needed or it to run, allow you to choose index once (does not create
inputs.conf)or continuously monitor. You can Browse to you file locations as well. - Selecting a Source Type lets you see how splunk will see your data, it allows you to create a new source type if you do not see one that splunk has found.
- Splunk determins the source type for major data types
- you can choose a different one on the dropdown
- or create your own
- Data Preview will show you how the processed events will be indexed. Look for Proper Separation and TimeStamps
- Numerous Pretrained sourcetypes
- Input Settings:
- App Context determins where the input settings are saved.
- default host name in the General settings is used, you can change this here
- Select the index in which the input should be stored or create a new one ( can lead to large gains in efficeincy )
- Events are available immediately after they are indexed.
- Home App
- Current App
- Search App
- Splunk Bar
- Current View
- Search Bar
- Search History
- Data Sources
- Global stats
- time range picker
- start search
- current app
- Data Summary Tabs
- Host -> Unique ID of origin
- Source -> Name of file, stream, input
- Sourectype -> specific data type
- Event Tab
- App
- Search
- Event
- Field
- Value
- Download the .zip file from the docs or the github. search tutorial
- Click the Add Data widget on the Home screen.
- Upload the entire
tutorials.zipfile; splunk will recognize it -
- In the add data wizard, at the
Input Settingsportion; the regular expression needed for Host:- click Segment in Path; Type
\\(.*)\/
- click Segment in Path; Type
- In the add data wizard, at the


