Name
Bollinger-Bands-RSI-OBV策略Bollinger-Bands-RSI-OBV-Strategy
Author
ChaoZhang
Strategy Description
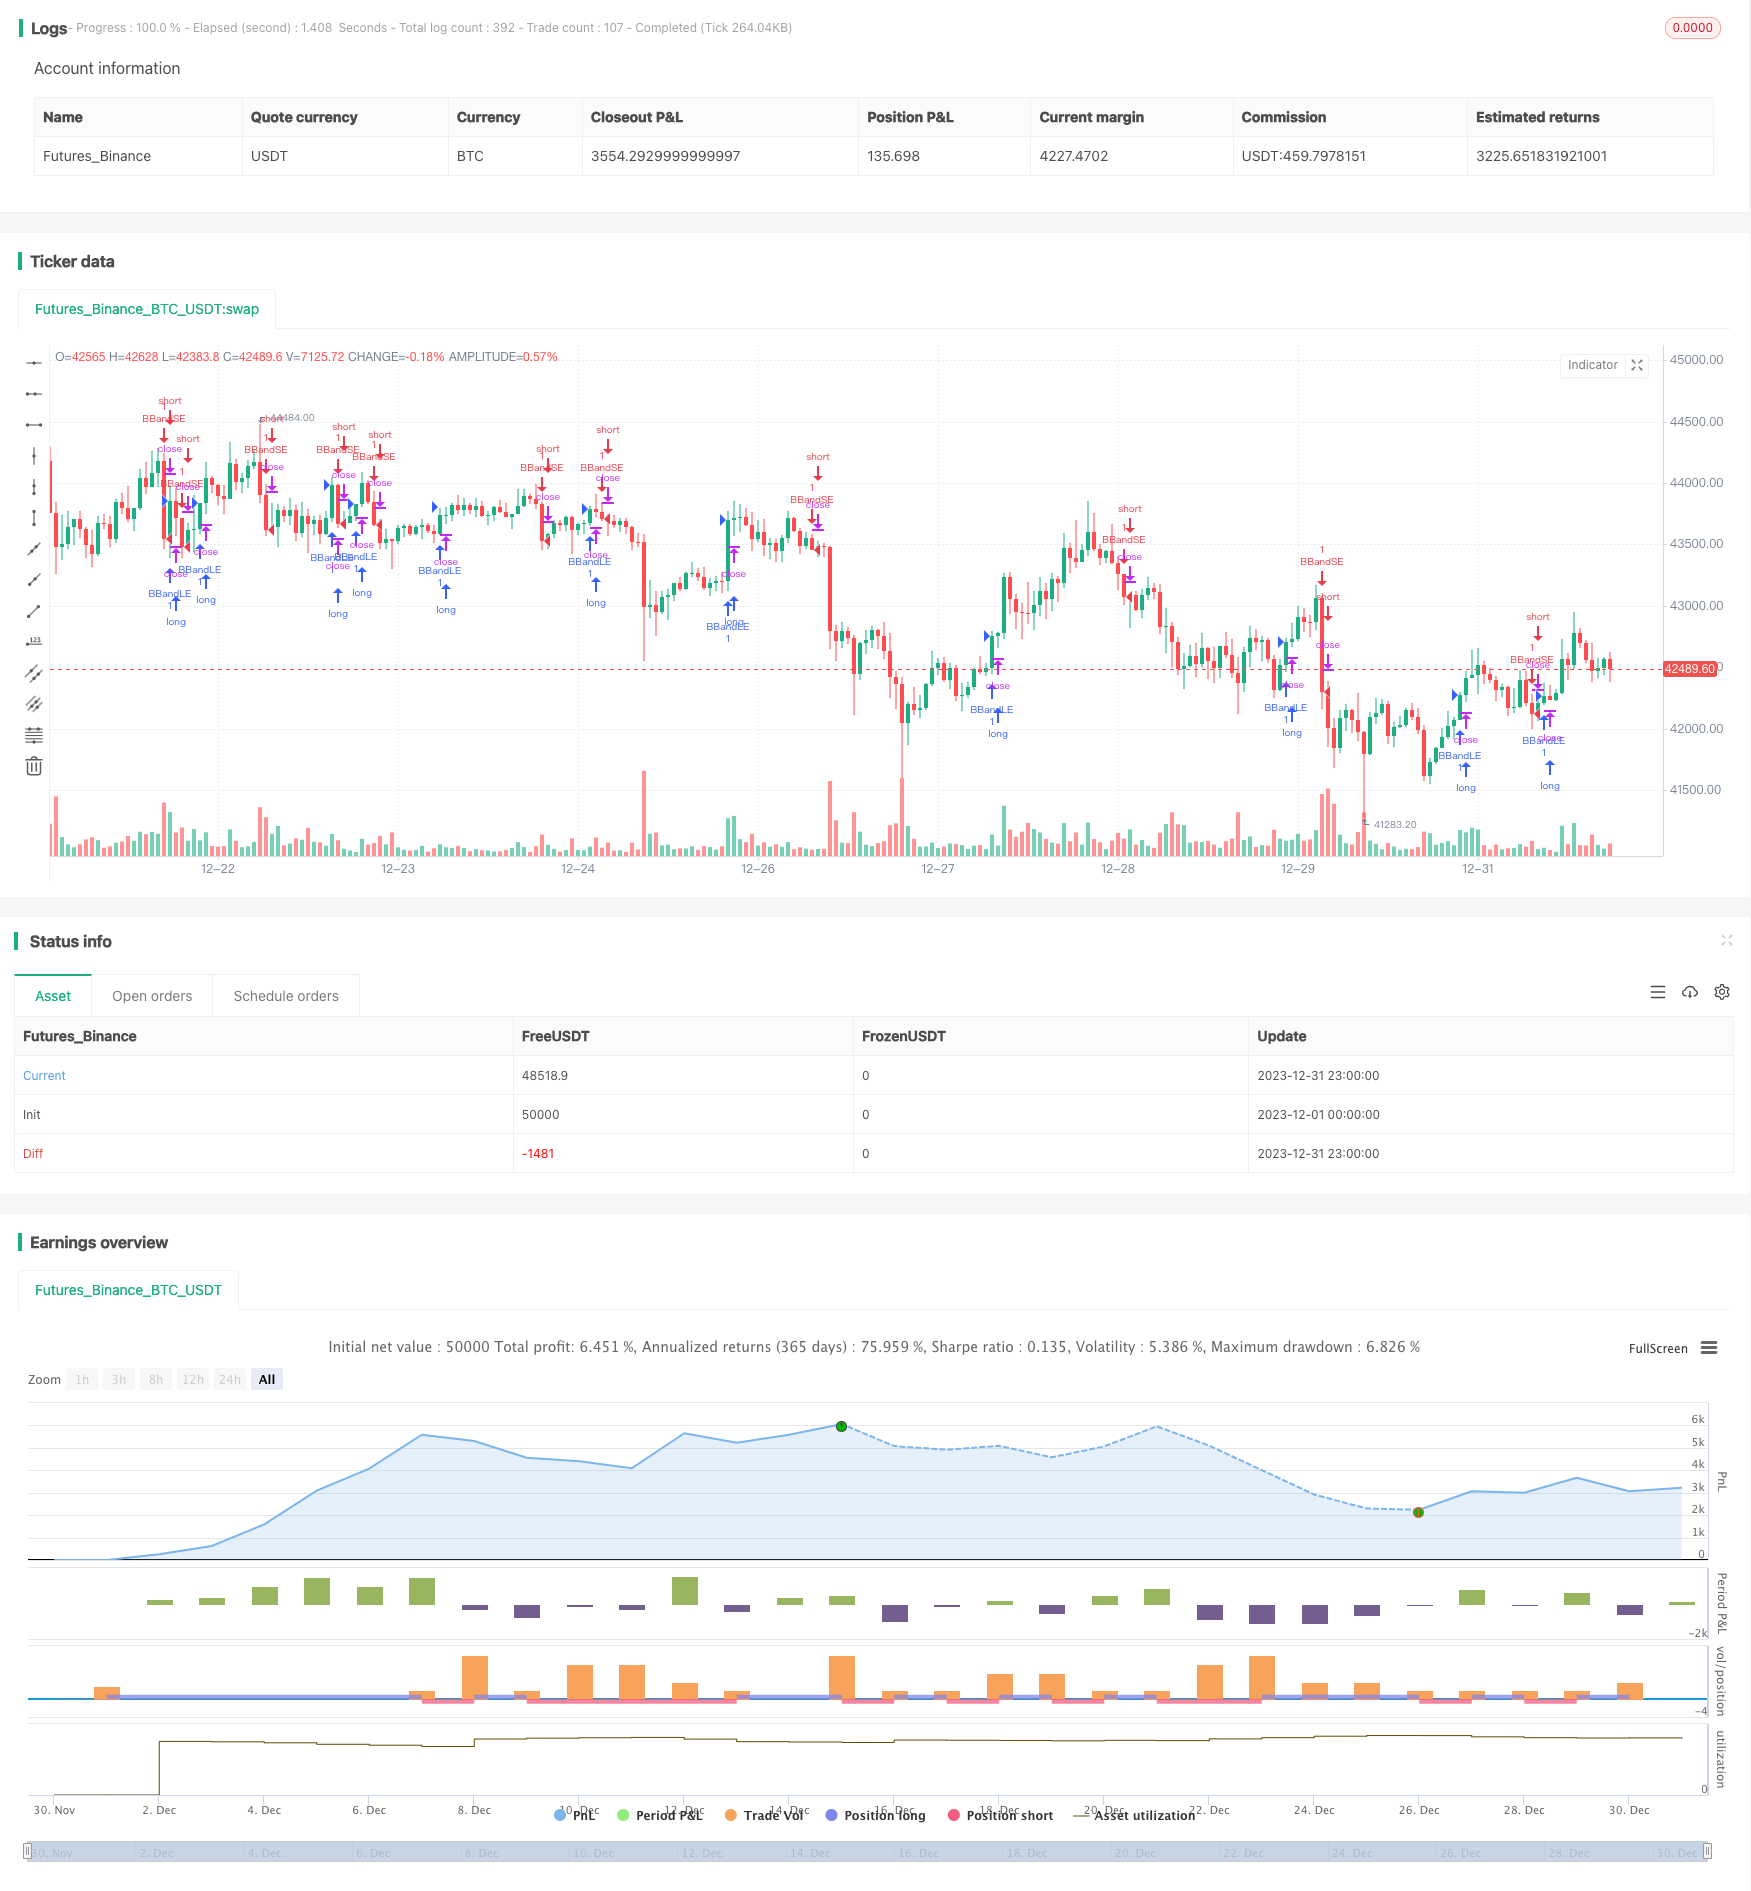
Bollinger Bands RSI OBV策略结合布林带、相对强弱指标(RSI)和平衡量指标(OBV)来识别股价的突破点与反转点。当股价突破布林带上下轨,并且RSI指标显示超买超卖,同时OBV指标出现转折时,该策略会发出交易信号。
该策略的交易逻辑主要基于布林带、RSI指标和OBV指标。具体来说:
- 当股价突破布林带中轨且向上,同时RSI大于50表示多头趋势形成,此时如果OBV指标回落表明短期内出现下跌,那么这个时候就是建仓多单的时机。
- 当股价跌破布林带下轨时候,平掉之前的多单头寸。
- 当股价突破布林带中轨且向下,同时RSI小于50表示空头趋势形成,此时如果OBV指标上升表明短期内出现反弹,那么这个时候就是建仓空单的时机。
- 当股价重新冲破布林带上轨时候,平掉之前的空单头寸。 所以该策略使用布林轨的突破来确定方向;再结合RSI判断强弱以及OBV判断短期反转,形成交易信号。
该策略最大的优势在于同时结合布林轨、RSI和OBV三种不同类型的指标,能够在股价开始方向性变化的时候提前捕捉到变化信号。例如股价突破布林中轨向上后,如果只看K线的话可能会直接建多单,但是结合RSI和OBV就能判断出此时是否存在短期调整的可能性从而避免建仓。所以这种组合指标能够提高策略的稳定性。 其次,该策略同时设置有突破布林轨的入场条件以及相反方向重新突破布林轨的止损条件。这能够控制每单的盈亏比例在一定的合理范围内,减少单笔损失的可能性。 最后,该策略代码逻辑清晰简洁,参数设定合理易于理解,适合作为模拟实盘的策略框架进行优化和改进。这降低了策略实盘时可能出现的风险。
该策略最大的风险在于布林轨宽度设置不当可能导致错失大量交易机会。如果布林轨间距设置过大,股价需要波动较大幅度才会触发建仓或止损逻辑。这可能错过一些比较小幅的趋势性机会。 此外,策略目前只考虑了买卖点选择逻辑,没有整合资金管理、仓位管理等方面的优化。这导致单边无限加仓的可能,容易因为无法及时止损退出造成较大亏损。 最後,RSI与OBV指标组合判断上也可能出现错误信号。RSI仅从一定周期内股价涨跌速度考虑,无法判断长期趋势;OBV也可能因为个股特点而变得不那么可靠。这都可能影响策略信号的准确性。
考虑到上述分析,该策略可以从以下几个方向进行优化:
- 对布林轨的宽度进行优化,设置自适应布林轨宽度以自动适应市场波动幅度。
- 整合仓位管理逻辑,当连续亏损时降低仓位规模。连续盈利时则适当加大仓位。
- 对RSI指标的参数如看涨周期等进行测试与优化。
- 尝试不同的短期指标如KDJ、MACD等替代OBV指标,判断是否能提高信号准确性。
- 测试不同的中长期指标如MVSL、DMI等与RSI结合使用,助力判断股价中长期走势。
Bollinger Bands RSI OBV策略综合运用三种不同类型的技术指标,在保证了一定的稳定性和筛选标准的同时,也为后续的优化和改进提供了框架基础。该策略适用于中长线的选股与持股,也可作为短线策略的基础来进行大幅度调整与优化。
||
The Bollinger Bands RSI OBV strategy combines Bollinger Bands, Relative Strength Index (RSI) and On Balance Volume (OBV) to identify breakout and reversal points of stock prices. When the stock price breaks through the upper and lower rails of the Bollinger Bands, and the RSI indicator shows overbought or oversold, while the OBV indicator shows a turn, this strategy will issue trading signals.
The trading logic of this strategy is mainly based on Bollinger Bands, RSI indicators and OBV indicators. Specifically:
-
When the stock price breaks through the middle rail of the Bollinger Bands and goes up, while the RSI is greater than 50 indicating the formation of a bullish trend, if the OBV indicator falls back at this time indicating a short-term decline, this is the time to open long positions.
-
When the stock price breaks through the lower rail of the Bollinger Bands, close the previous long positions.
-
When the stock price breaks through the middle rail of the Bollinger Bands and goes down, while the RSI is less than 50 indicating the formation of a bearish trend, if the OBV indicator rises at this time indicating a short-term rebound, this is the time to open short positions.
-
When the stock price breaches the upper rail of the Bollinger Bands again, close the previous short positions.
So this strategy uses the breakout of Bollinger rails to determine direction; combines RSI to judge strength and weakness and OBV to judge short-term reversals to generate trading signals.
The biggest advantage of this strategy is that it combines three different types of indicators: Bollinger Bands, RSI and OBV, which can capture changes in signals in advance when stock prices start to change directionally. For example, after the stock price breaks through the middle rail of the Bollinger Bands upwards, if you just look at the K-line chart, you may directly open long positions. However, combining RSI and OBV can determine if there is a possibility of short-term adjustment at this time thereby avoiding opening positions. Therefore, such a combination of indicators can improve the stability of the strategy.
Secondly, this strategy sets the entry condition of breaking through the Bollinger Bands as well as the stop loss condition of breaking through the Bollinger Bands in the opposite direction. This can keep the risk-reward ratio of each position within a reasonable range and reduce the possibility of a single loss.
Finally, the code logic of this strategy is clear and concise, and the parameter settings are reasonable and easy to understand, making it suitable as a simulation strategy framework for optimization and improvement. This reduces the risks that may occur when the strategy goes live.
The biggest risk of this strategy is that improper setting of the width of the Bollinger Bands may result in missing a lot of trading opportunities. If the interval between Bollinger Bands is set too large, stock prices need to fluctuate greatly in magnitude to trigger opening or stop loss logic. This may miss some relatively small trend opportunities.
In addition, the current strategy only considers the logic of selecting buying and selling points without integrating capital management, position management and other optimizations. This can lead to unlimited one-sided accumulation, which can easily lead to greater losses due to inability to stop losses in time.
Finally, the combination of RSI and OBV indicators may also have wrong signals. The RSI only considers the speed of rises and falls in stock prices over a certain period of time, and cannot determine long-term trends; The OBV can also become less reliable due to the characteristics of individual stocks. These can all affect the accuracy of strategy signals.
In view of the above analysis, the strategy can be optimized in the following aspects:
-
Optimize the width of Bollinger Bands to set adaptive widths to automatically adapt to market volatility.
-
Integrate position management logic to reduce position size when continuous losses occur. And appropriately increase positions when continuous profits occur.
-
Test and optimize parameters of RSI indicators such as lookback period for rises etc.
-
Try different short-term indicators such as KDJ, MACD etc. to replace OBV indicators to determine if signal accuracy can be improved.
-
Test different medium and long term indicators such as MVSL, DMI combined with RSI to assist in determining the medium and long term trend of stock prices.
The Bollinger Bands RSI OBV strategy comprehensively uses three different types of technical indicators to provide a framework basis for subsequent optimization and improvement while ensuring certain stability and screening criteria. This strategy is suitable for mid-to-long term stock selection and holdings, and can also be used as the basis for short-term strategies to make significant adjustments and optimizations.
[/trans]
Strategy Arguments
| Argument | Default | Description |
|---|---|---|
| v_input_1 | 20 | length |
| v_input_2 | 2 | mult |
Source (PineScript)
/*backtest
start: 2023-12-01 00:00:00
end: 2023-12-31 23:59:59
period: 1h
basePeriod: 15m
exchanges: [{"eid":"Futures_Binance","currency":"BTC_USDT"}]
*/

// This source code is subject to the terms of the Mozilla Public License 2.0 at https://mozilla.org/MPL/2.0/
// © atakhadivi

//@version=4
strategy("BB+RSI+OBV", overlay=true)

src = close
obv = cum(sign(change(src)) * volume)
// plot(obv, color=#3A6CA8, title="OnBalanceVolume")

source = close
length = input(20, minval=1)
mult = input(2.0, minval=0.001, maxval=50)
basis = sma(source, length)
dev = mult * stdev(source, length)
upper = basis + dev
lower = basis - dev
buyEntry = source > basis and rsi(close, 14) > 50 and obv[1] < obv
buyExit = source < lower
sellEntry = source < basis and rsi(close, 14) < 50 and obv[1] > obv
sellExit = source > upper
strategy.entry("BBandLE", strategy.long, stop=lower, oca_name="BollingerBands",comment="BBandLE", when=buyEntry)
strategy.exit(id='BBandLE', when=buyExit)
strategy.entry("BBandSE", strategy.short, stop=upper, oca_name="BollingerBands", comment="BBandSE", when=sellEntry)
strategy.exit(id='BBandSE', when=sellExit)
Detail
https://www.fmz.com/strategy/440339
Last Modified
2024-01-29 14:49:29