Name
ADX动态平均趋势指标策略ADX-Dynamic-Trend-Strategy
Author
ChaoZhang
Strategy Description
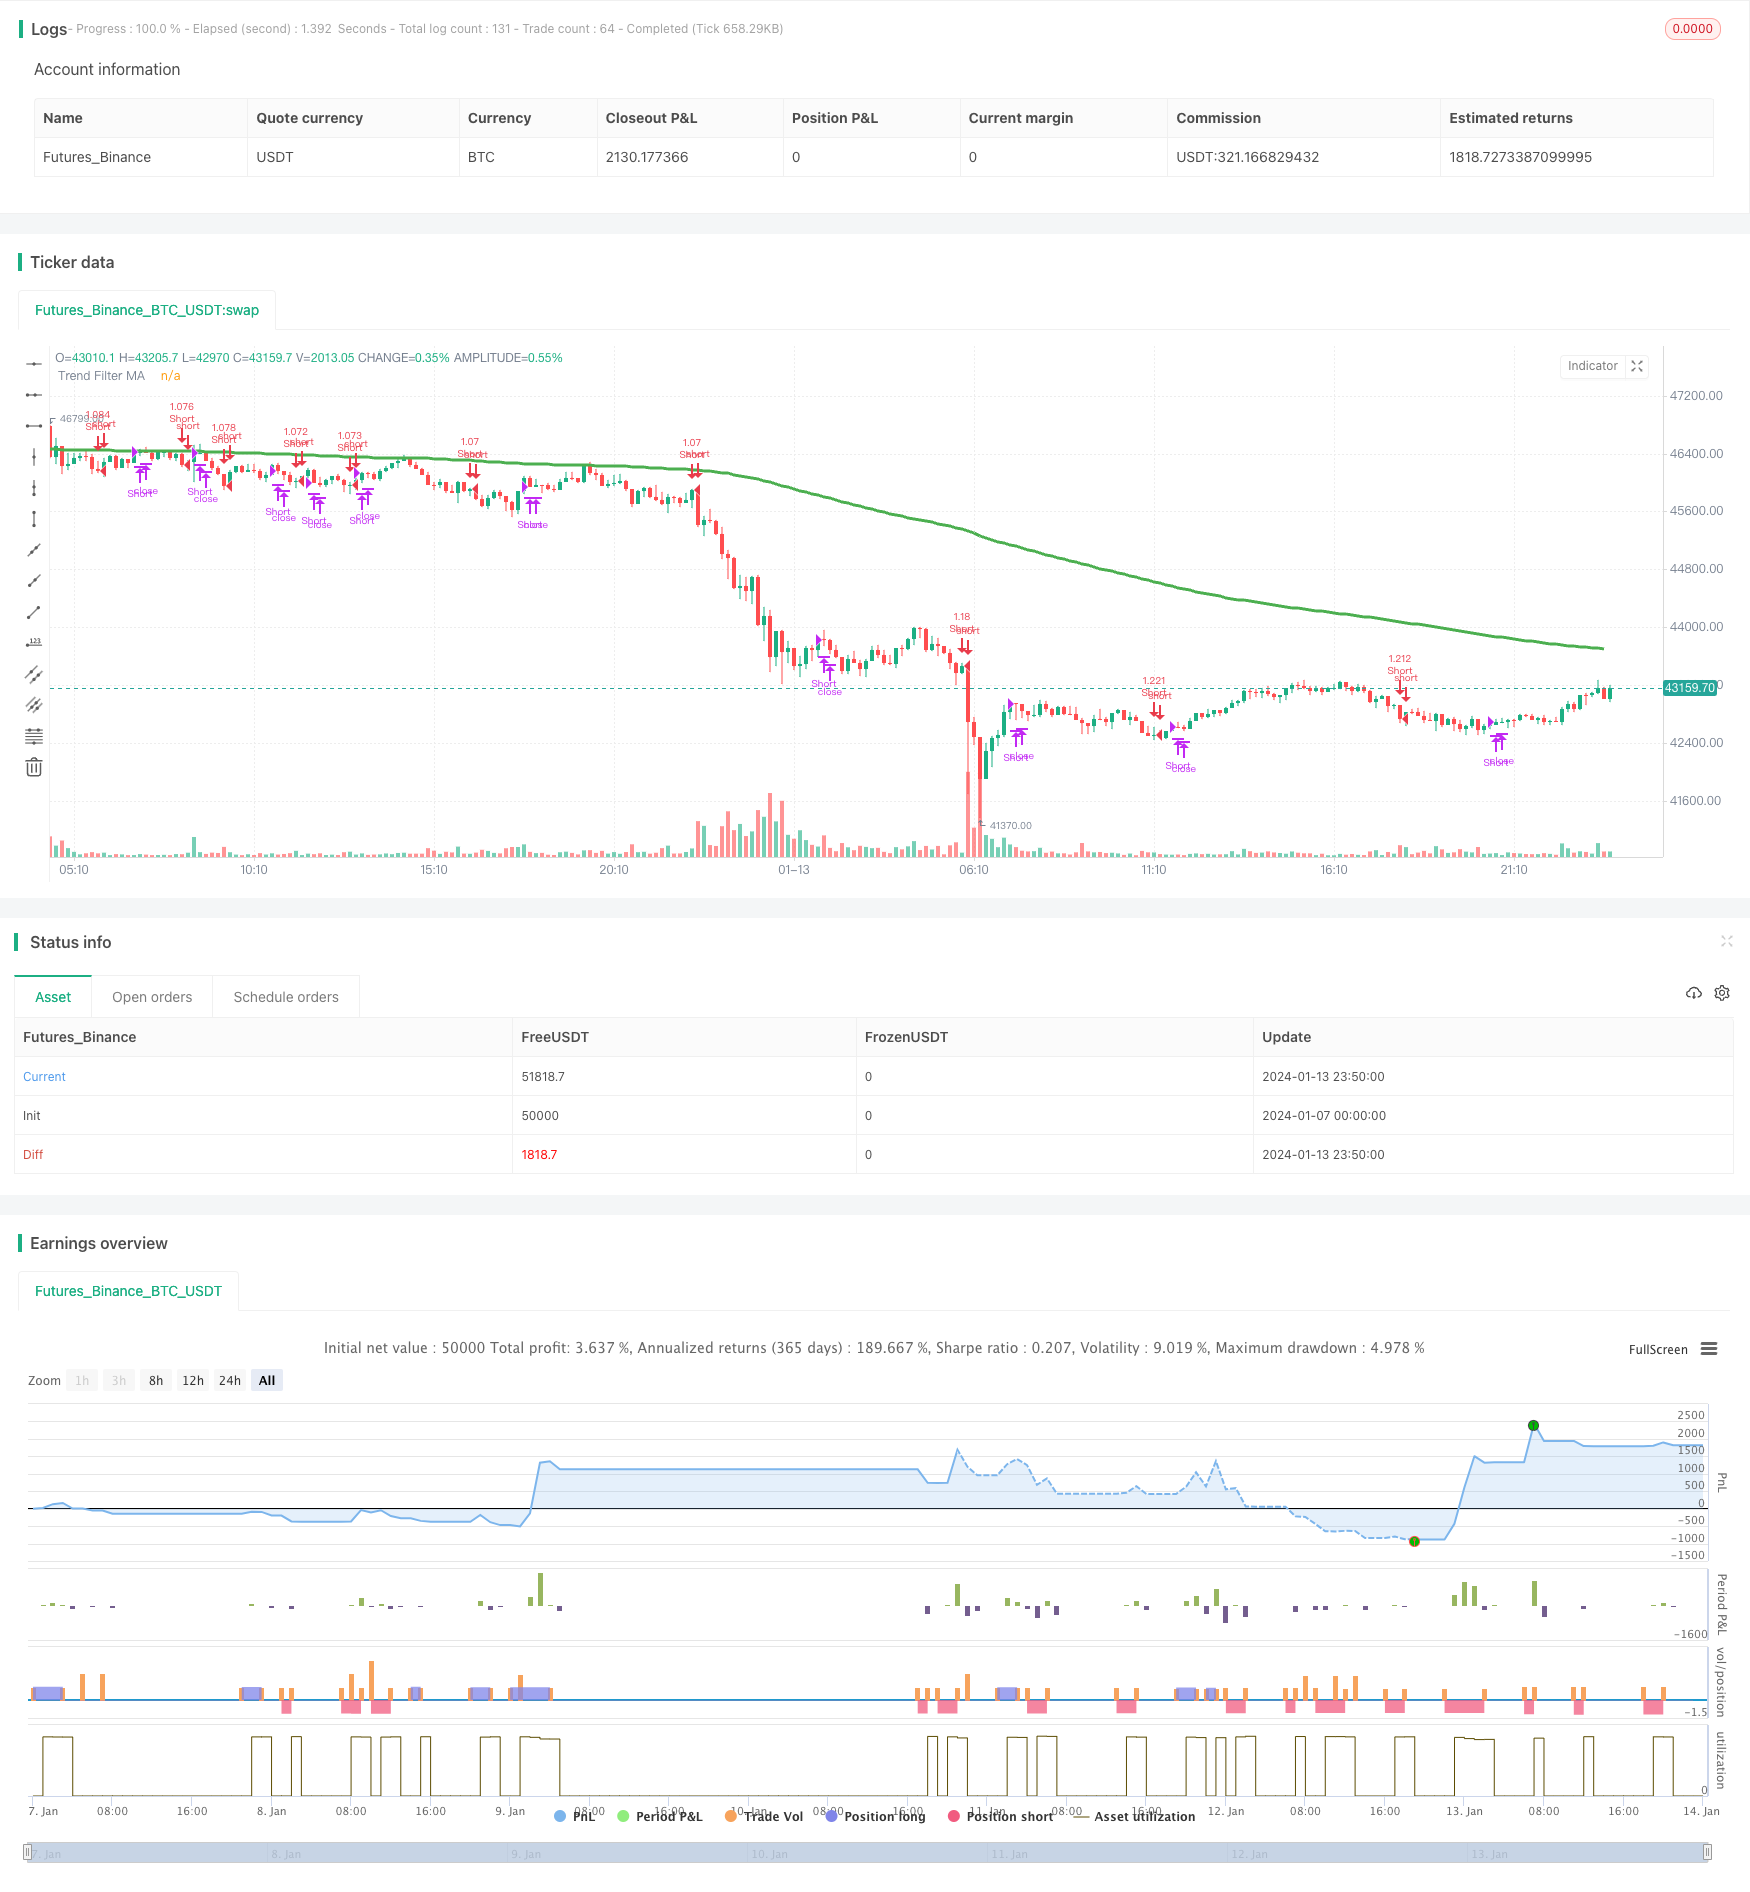
ADX动态平均趋势指标策略是一种利用ADX指标判断市场趋势强弱以及趋势方向的量化交易策略。该策略通过计算平均方向指数(ADX)判断市场是否存在趋势,通过计算正向指标(DI+)和负向指标(DI-)判断趋势的方向,从而产生买入和卖出信号。
该策略首先利用ADX指标判断市场是否存在趋势。ADX高于用户设定的关键值(默认为23),表示市场趋势较强。当ADX的当前值高于ADX之前n天的值时(n为用户设定的回看天数,默认为3天),表示ADX正在上涨,市场趋势正在形成。
然后策略利用DI+和DI-判断市场趋势的方向。当DI+高于DI-时,表示市场处于上涨趋势;当DI+低于DI-时,表示市场处于下跌趋势。
最后,策略综合判断ADX和DI的情况,产生具体的买入和卖出信号:
- 当ADX上涨,高于关键值,且DI+高于DI-,产生买入信号
- 当ADX上涨,高于关键值,且DI+低于DI-,产生卖出信号
- 当ADX转为下降,产生平仓信号
该策略还提供移动平均线过滤和定制回测时间范围等功能,可以按需配置。
ADX动态平均趋势指标策略具有以下优势:
- 可以自动判断市场趋势存在与否,避免无效交易
- 可以自动判断市场趋势方向,进行趋势追踪
- 提供趋势存在时买入/趋势消失时平仓的清晰逻辑
- 可配置移动平均线进行过滤,避免假突破
- 可配置回测时间范围进行历史测试
- 指标和参数可调整,可以针对不同品种进行优化
该策略也存在一些风险:
- ADX指标存在滞后,可能错过趋势早期机会
- 多空判断依赖DI指标,DI指标敏感,可能产生错误信号
- 移动平均线过滤可能错过短线机会
- 回测时间范围不当可能导致过拟合
- 指标参数设置不当可能影响策略效果
为了降低风险,可以考虑以下几点:
- 适当缩短ADX参数,减少滞后
- 调整或删除DI过滤,防止错误信号
- 适当缩短移动平均线周期
- 扩大回测时间范围,进行全样本测试
- 优化指标参数,寻找最佳设置
该策略可以从以下几个方面进行优化:
- 结合多个股票进行组合测试,分散单一股票风险
- 增加止损逻辑以控制单笔损失
- 结合其他指标进行组合验证,提高信号准确率
- 引入机器学习算法判断买卖信号
- 增加自动参数优化模块,实现动态参数调整
ADX动态平均趋势指标策略利用ADX判断趋势存在和DI判断趋势方向,在趋势存在时产生交易信号,策略思路清晰。该策略可以自动判断趋势,追踪趋势,在一定程度上规避非趋势市场的无效交易。通过一定的优化,该策略可以成为中长线量化交易的有力工具。
||
The ADX Dynamic Trend Strategy is a quantitative trading strategy that utilizes the ADX indicator to determine the strength and direction of market trends. It generates buy and sell signals by calculating the Average Directional Index (ADX) to judge if a trend exists in the market and by calculating the Positive Directional Indicator (DI+) and Negative Directional Indicator (DI-) to determine the direction of the trend.
The strategy first uses the ADX indicator to determine if a trend exists in the market. When ADX is above a user-defined key level (default 23), it signals that the market trend is relatively strong. When the current ADX value is higher than the ADX value n days ago (n is the user-defined lookback period, default 3 days), it signals that ADX is rising and a trend is forming in the market.
The strategy then utilizes DI+ and DI- to determine the direction of the market trend. When DI+ is higher than DI-, it signals an uptrend in the market. When DI+ is lower than DI-, it signals a downtrend in the market.
Finally, the strategy combines the ADX and DI analysis to generate specific buy and sell signals:
- When ADX rises and is above key level and DI+ is higher than DI-, a buy signal is generated
- When ADX rises and is above key level and DI+ is lower than DI-, a sell signal is generated
- When ADX turns to decrease, a flatten position signal is generated
The strategy also provides features like moving average filtering and customizable backtesting time range.
The ADX Dynamic Trend Strategy has the following advantages:
- Automatically detect the existence of market trends, avoiding ineffective trading
- Automatically determine the direction of market trends for trend following
- Clear logic of buying on trend existence and flattening on trend disappearance
- Configurable moving average filtering avoids false breakouts
- Customizable backtesting time range for historical testing
- Adjustable indicator parameters for optimization across different products
The strategy also has some risks:
- ADX indicator has lagging effect, possibly missing early trend opportunities
- Trend direction reliance on DI may produce false signals as DI is sensitive
- Moving average filter may miss short-term opportunities
- Improper backtesting time frame may cause overfitting
- Improper indicator parameters may affect strategy performance
To mitigate risks, the following can be considered:
- Shorten ADX parameters to reduce lagging
- Remove or adjust DI filter to prevent false signals
- Shorten moving average period
- Expand backtesting time frame for full sample testing
- Optimize parameters to find best settings
The strategy can be enhanced from the following aspects:
- Portfolio testing across multiple stocks to diversify single-stock risk
- Add stop loss logic to control per trade loss
- Combine with other indicators for signal verification to improve accuracy
- Introduce machine learning algorithms for buy/sell signal generation
- Add auto parameter tuning module for dynamic adjustment
The ADX Dynamic Trend Strategy utilizes ADX to determine trend existence and DI for trend direction. It generates trading signals when a trend exists and flattens positions when the trend disappears. The logic is clear. By automatically detecting and tracking trends, ineffective trading can be avoided to some extent in non-trending markets. With proper enhancement, this strategy can become a powerful tool for medium-to-long term quantitative trading.
[/trans]
Strategy Arguments
| Argument | Default | Description |
|---|---|---|
| v_input_1 | 2019 | From Year |
| v_input_2 | true | From Month |
| v_input_3 | true | From Day |
| v_input_4 | 9999 | To Year |
| v_input_5 | true | To Month |
| v_input_6 | true | To Day |
| v_input_7 | 14 | ADX Smoothing |
| v_input_8 | 14 | DI Period |
| v_input_9 | 23 | Keylevel for ADX |
| v_input_10 | 3 | Lookback Period for Slope |
| v_input_11 | true | Use MA for Filtering? |
| v_input_12 | 0 | MA Type For Filtering: EMA |
| v_input_13 | 200 | MA Period for Filtering |
Source (PineScript)
/*backtest
start: 2024-01-07 00:00:00
end: 2024-01-14 00:00:00
period: 10m
basePeriod: 1m
exchanges: [{"eid":"Futures_Binance","currency":"BTC_USDT"}]
*/

//@version=4
// This source code is subject to the terms of the Mozilla Public License 2.0 at https://mozilla.org/MPL/2.0/
// © millerrh with inspiration from @9e52f12edd034d28bdd5544e7ff92e
//The intent behind this study is to look at ADX when it has an increasing slope and is above a user-defined key level (23 default).
//This is to identify when it is trending.
//It then looks at the DMI levels.  If D+ is above D- and the ADX is sloping upwards and above the key level, it triggers a buy condition.  Opposite for short.
//Can use a user-defined moving average to filter long/short if desried.
// NOTE: THIS IS MEANT TO BE USED IN CONJUNCTION WITH MY "ATX TRIGGER" INDICATOR FOR VISUALIZATION. MAKE SURE SETTINGS ARE THE SAME FOR BOTH.

strategy("ADX | DMI Trend", overlay=true, initial_capital=10000, currency='USD',
   default_qty_type=strategy.percent_of_equity, default_qty_value=100, commission_type=strategy.commission.percent, commission_value=0.04)

// === BACKTEST RANGE ===
From_Year  = input(defval = 2019, title = "From Year")
From_Month = input(defval = 1, title = "From Month", minval = 1, maxval = 12)
From_Day   = input(defval = 1, title = "From Day", minval = 1, maxval = 31)
To_Year    = input(defval = 9999, title = "To Year")
To_Month   = input(defval = 1, title = "To Month", minval = 1, maxval = 12)
To_Day     = input(defval = 1, title = "To Day", minval = 1, maxval = 31)
Start  = timestamp(From_Year, From_Month, From_Day, 00, 00)  // backtest start window
Finish = timestamp(To_Year, To_Month, To_Day, 23, 59)        // backtest finish window

// == INPUTS ==
// ADX Info
adxlen = input(14, title="ADX Smoothing")
dilen = input(14, title="DI Period")
keyLevel = input(23, title="Keylevel for ADX")
adxLookback = input(3, title="Lookback Period for Slope")

// == FILTERING ==
// Inputs
useMaFilter = input(title = "Use MA for Filtering?", type = input.bool, defval = true)
maType = input(defval="EMA", options=["EMA", "SMA"], title = "MA Type For Filtering")
maLength   = input(defval = 200, title = "MA Period for Filtering", minval = 1)

// Declare function to be able to swap out EMA/SMA
ma(maType, src, length) =>
    maType == "EMA" ? ema(src, length) : sma(src, length) //Ternary Operator (if maType equals EMA, then do ema calc, else do sma calc)
maFilter = ma(maType, close, maLength)
plot(maFilter, title = "Trend Filter MA", color = color.green, linewidth = 3, style = plot.style_line, transp = 50)

// Check to see if the useMaFilter check box is checked, this then inputs this conditional "maFilterCheck" variable into the strategy entry
maFilterCheck = if useMaFilter == true
    maFilter
else
    close

// == USE BUILT-IN DMI FUNCTION TO DETERMINE ADX AND BULL/BEAR STRENGTH
[diplus, diminus, adx] = dmi(dilen, adxlen)

buySignal = (adx[0]-adx[adxLookback] > 0) and adx > keyLevel and diplus > diminus  and close >= maFilterCheck
// buySignalValue = valuewhen(buySignal, close, 0)
shortSignal = (adx[0]-adx[adxLookback] > 0) and adx > keyLevel and diplus < diminus  and close <= maFilterCheck
// shortSignalValue = valuewhen(shortSignal, close, 0)
sellCoverSignal = adx[0]-adx[adxLookback] < 0

// == ENTRY & EXIT CRITERIA
// Triggers to be TRUE for it to fire of the BUY Signal : (opposite for the SELL signal).
// (1): Price is over the 200 EMA line. (EMA level configurable by the user)
// (2): "D+" is OVER the "D-" line
// (3): RSI 7 is under 30 (for SELL, RSI 7 is over 70)
// 1* = The ultimate is to have a combination line of 3 EMA values, EMA 14, EMA 50 and EMA 200 - And if price is over this "combo" line, then it's a strong signal

// == STRATEGY ENTRIES/EXITS ==
strategy.entry("Long", strategy.long, when = buySignal)
strategy.close("Long", when = sellCoverSignal)
strategy.entry("Short", strategy.short, when = shortSignal)
strategy.close("Short", when = sellCoverSignal)

// == ALERTS ==
// alertcondition(buySignal, title='ADX Trigger Buy', message='ADX Trigger Buy')
// alertcondition(sellSignal, title='ADX Trigger Sell', message='ADX Trigger Sell')
Detail
https://www.fmz.com/strategy/438826
Last Modified
2024-01-15 15:32:45