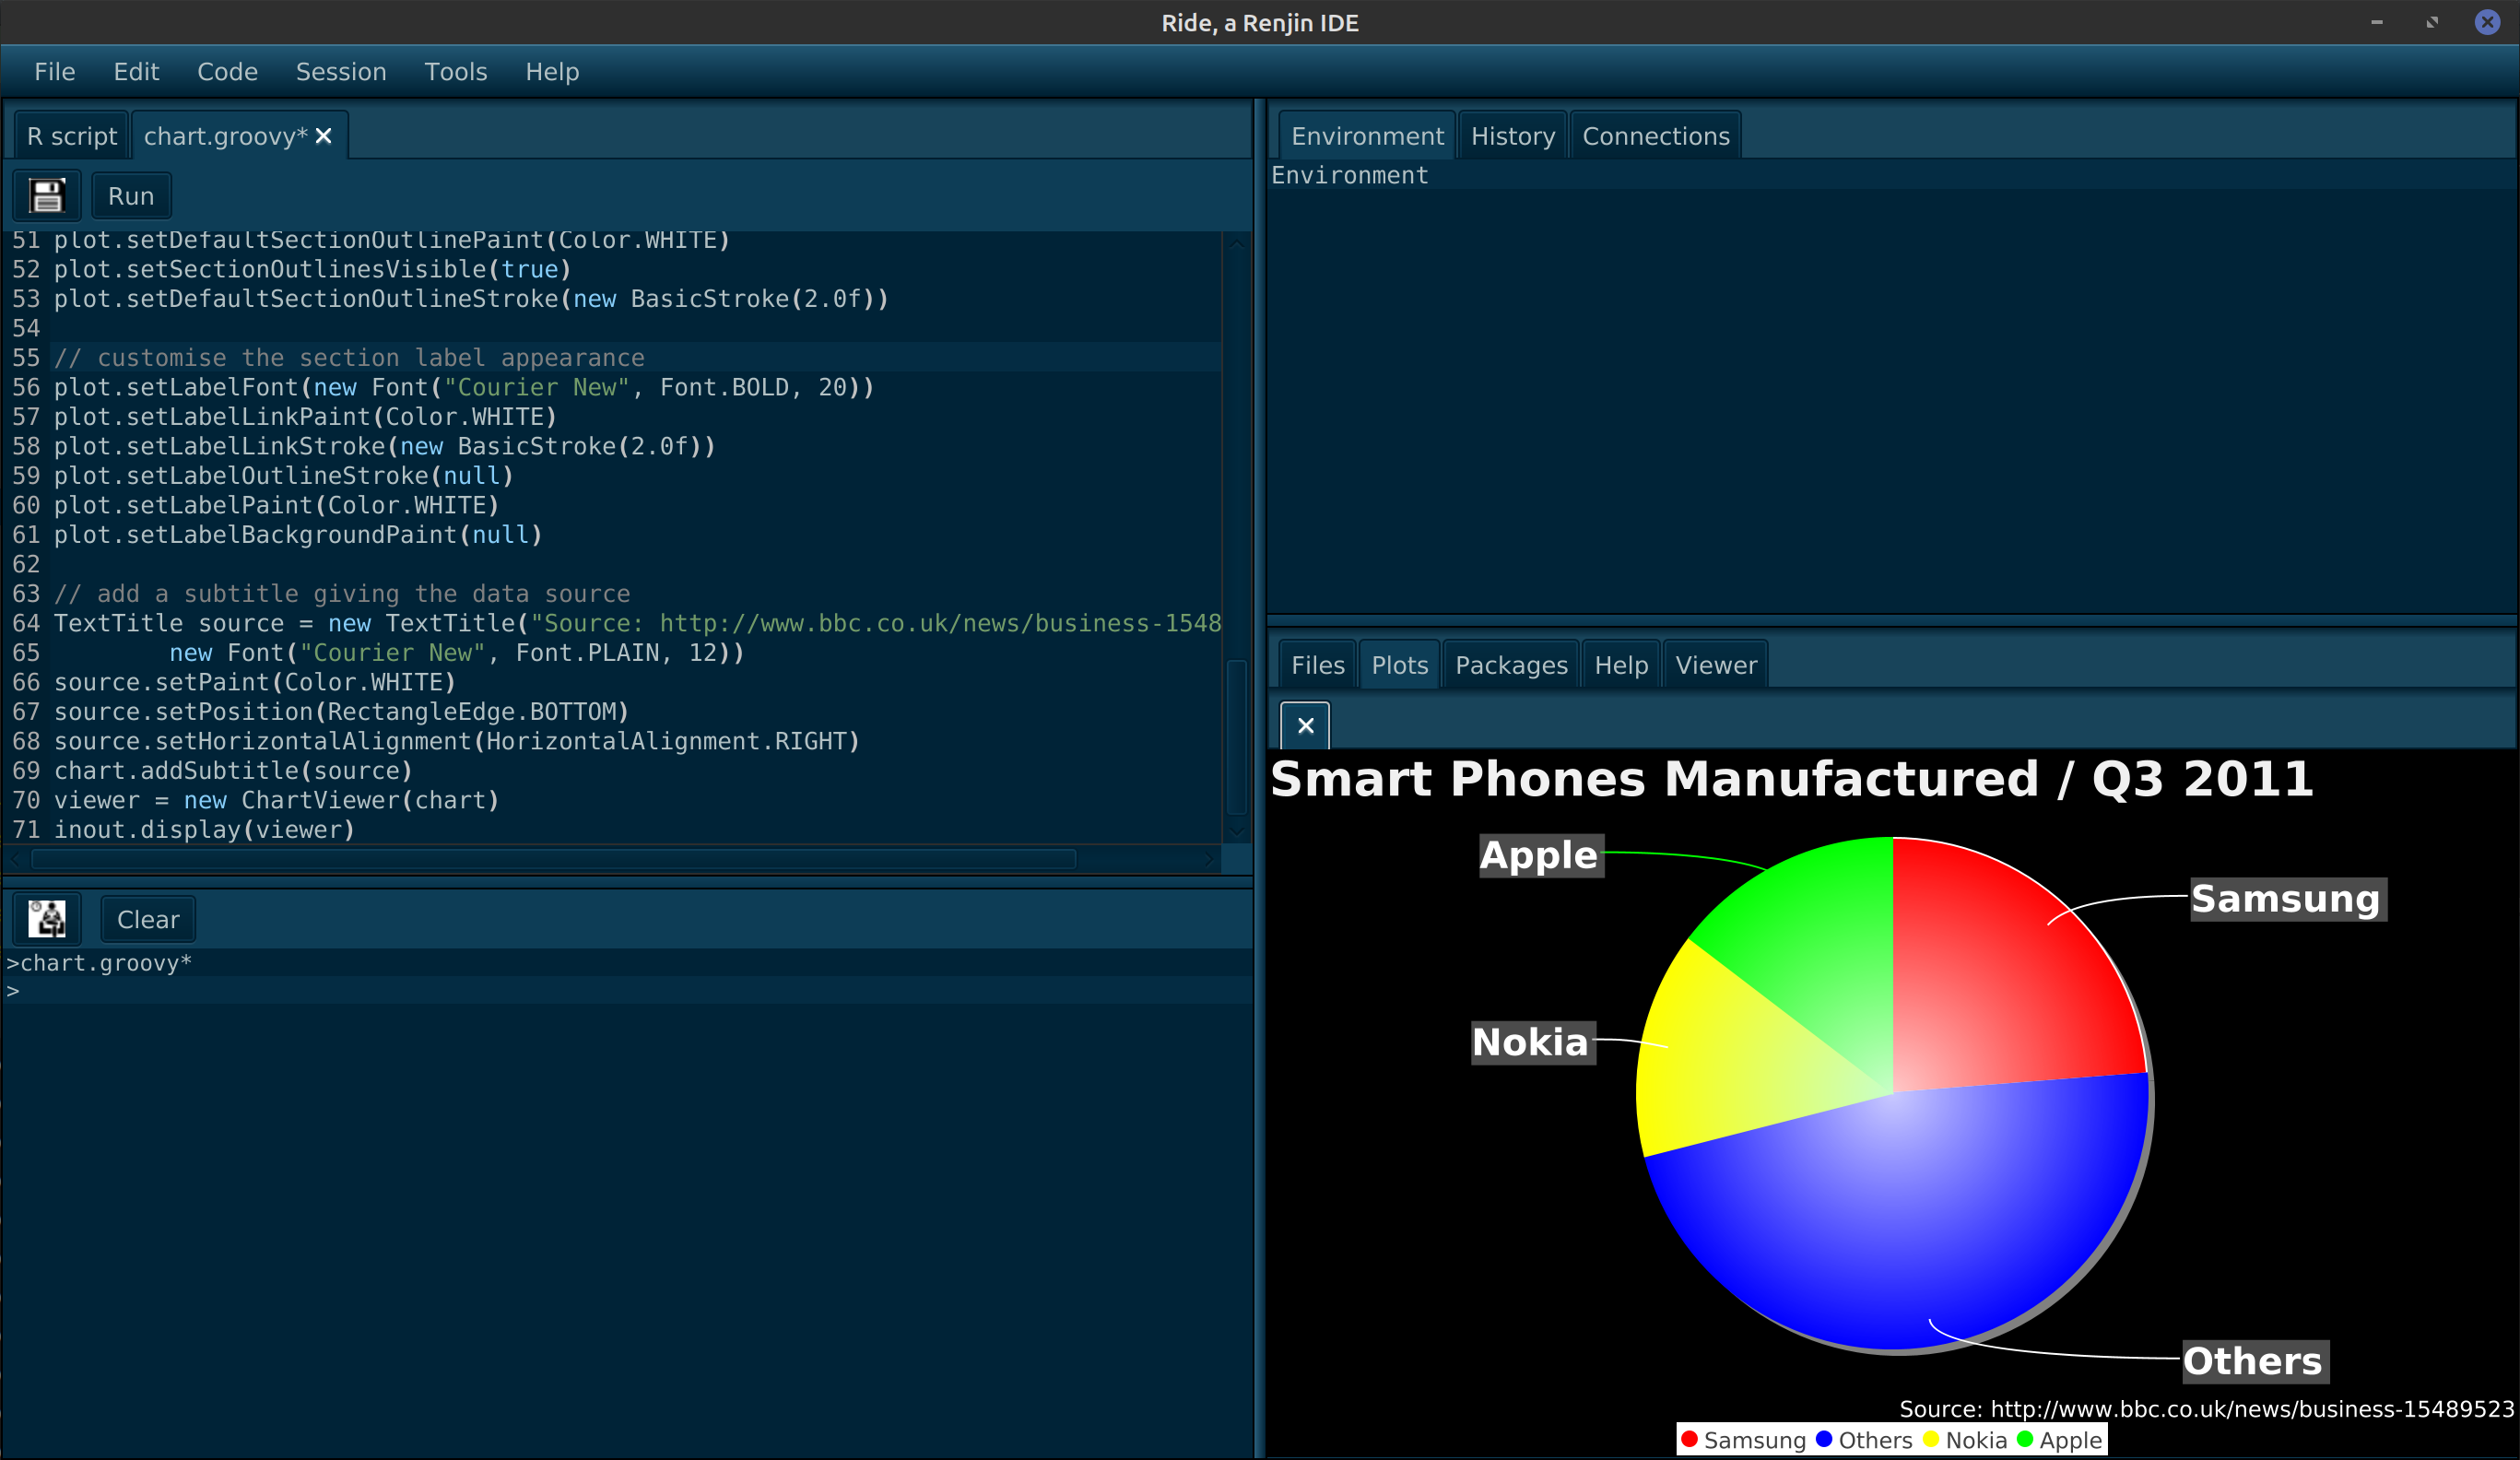
Groovy support was added to Ride 1.2.1. It makes it somewhat more convenient to prototype java and R interactions useful in developing, testing as well as certain data analysis situations.
Just as with R code, the inout component in injected into the Groovy session allowing you to interact with Ride in a simple way. E.g: (sample adopted from PieChartFXDemo1)
@Grab('org.jfree:jfreechart:1.5.3')
@Grab(group='org.jfree', module='jfreechart-fx', version='1.0.1')
import java.awt.BasicStroke
import java.awt.Color
import java.awt.Font
import java.awt.RadialGradientPaint
import java.awt.geom.Point2D
import org.jfree.chart.ChartFactory
import org.jfree.chart.fx.ChartViewer;
import org.jfree.chart.title.TextTitle;
import org.jfree.chart.ui.HorizontalAlignment;
import org.jfree.chart.ui.RectangleEdge;
import org.jfree.data.general.DefaultPieDataset


def createGradientPaint(Color c1, Color c2) {
    def center = new Point2D.Float(0, 0)
    def radius = 200f
    def dist = [0.0f, 1.0f] as float[]
    return new RadialGradientPaint(center, radius, dist, new Color[] {c1, c2})
}

def dataset = new DefaultPieDataset()
dataset.setValue("Samsung", new Double(27.8))
dataset.setValue("Others", new Double(55.3))
dataset.setValue("Nokia", new Double(16.8))
dataset.setValue("Apple", new Double(17.1))

chart = ChartFactory.createPieChart("Smart Phones Manufactured / Q3 2011", dataset)
chart.setBackgroundPaint(Color.BLACK)
// customise the title position and font
def title = chart.getTitle()
title.setHorizontalAlignment(HorizontalAlignment.LEFT)
title.setPaint(new Color(240, 240, 240))
title.setFont(new Font("Arial", Font.BOLD, 26))

def plot = chart.getPlot()
plot.setBackgroundPaint(Color.BLACK)
plot.setInteriorGap(0.04)
plot.setOutlineVisible(false)

// use gradients and white borders for the section colours
plot.setSectionPaint("Others", createGradientPaint(new Color(200, 200, 255), Color.BLUE))
plot.setSectionPaint("Samsung", createGradientPaint(new Color(255, 200, 200), Color.RED))
plot.setSectionPaint("Apple", createGradientPaint(new Color(200, 255, 200), Color.GREEN))
plot.setSectionPaint("Nokia", createGradientPaint(new Color(200, 255, 200), Color.YELLOW))
plot.setDefaultSectionOutlinePaint(Color.WHITE)
plot.setSectionOutlinesVisible(true)
plot.setDefaultSectionOutlineStroke(new BasicStroke(2.0f))

// customise the section label appearance
plot.setLabelFont(new Font("Courier New", Font.BOLD, 20))
plot.setLabelLinkPaint(Color.WHITE)
plot.setLabelLinkStroke(new BasicStroke(2.0f))
plot.setLabelOutlineStroke(null)
plot.setLabelPaint(Color.WHITE)
plot.setLabelBackgroundPaint(null)

// add a subtitle giving the data source
def source = new TextTitle("Source: http://www.bbc.co.uk/news/business-15489523",
        new Font("Courier New", Font.PLAIN, 12))
source.setPaint(Color.WHITE)
source.setPosition(RectangleEdge.BOTTOM)
source.setHorizontalAlignment(HorizontalAlignment.RIGHT)
chart.addSubtitle(source)
viewer = new ChartViewer(chart)
inout.display(viewer)
Just like With R code you can execute line by line by pressing ctrl+enter (ctrl+enter executes the selected code if any otherwise the current line). There is a session concept somewhat similar to R although in the Groovy case there is one session (GroovyShell) for each Tab (with R code the session is Global).
If you want to make the groovy code part of an R package (Renjin extension) it is a bit more involved. The easiest I have found is to use the groovy-eclipse-compiler to compile the Groovy code into class files that can be used in your Renjin R code and/or Java code.
