Skip to content

Latest commit


History

History
29 lines (18 loc) · 1.51 KB

File metadata and controls

29 lines (18 loc) · 1.51 KB

Covid_statewise_tracker_dashboard

Find the code above

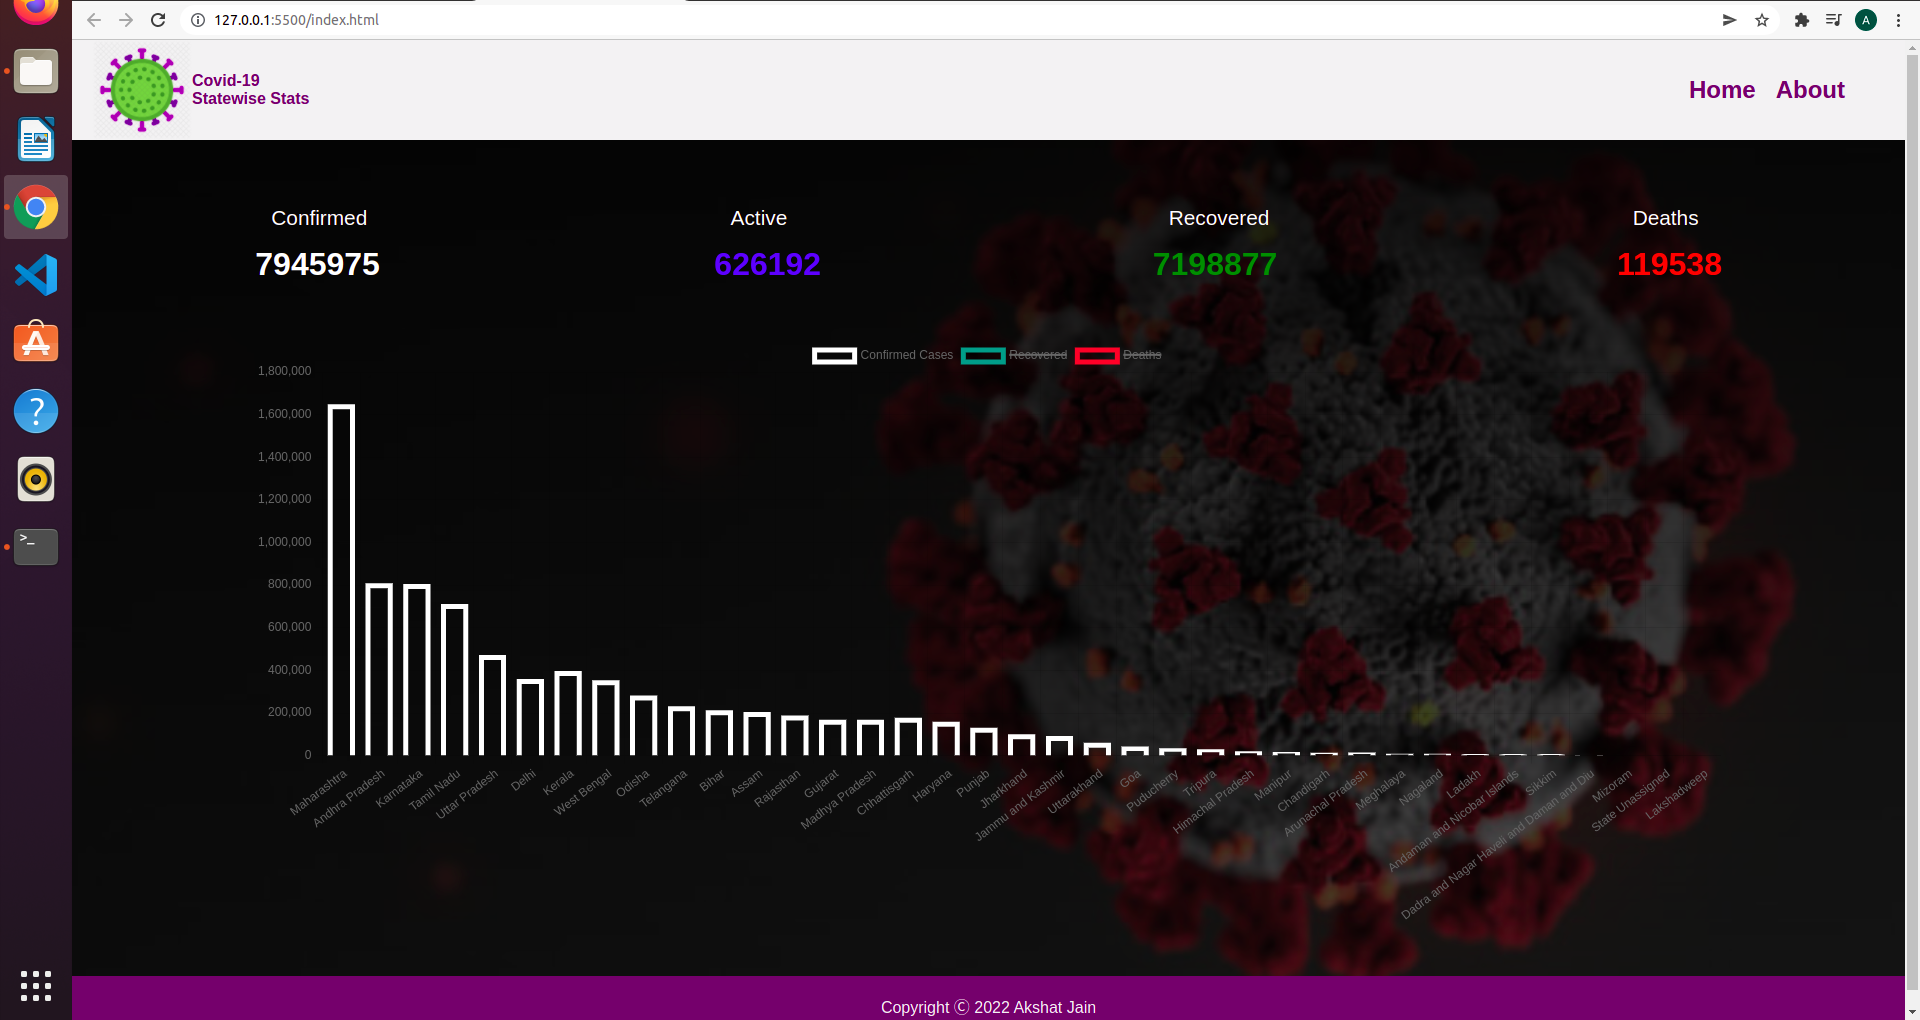
In this I have created a covid tracker dashborad that will represent how many cases are found per states.It includes confirmed cases, deaths,recovered per statewise using Html Css Vanilla Javascript Screenshot from 2022-03-09 19-34-06
It shows Confirmed Cases. Screenshot from 2022-03-09 19-34-32

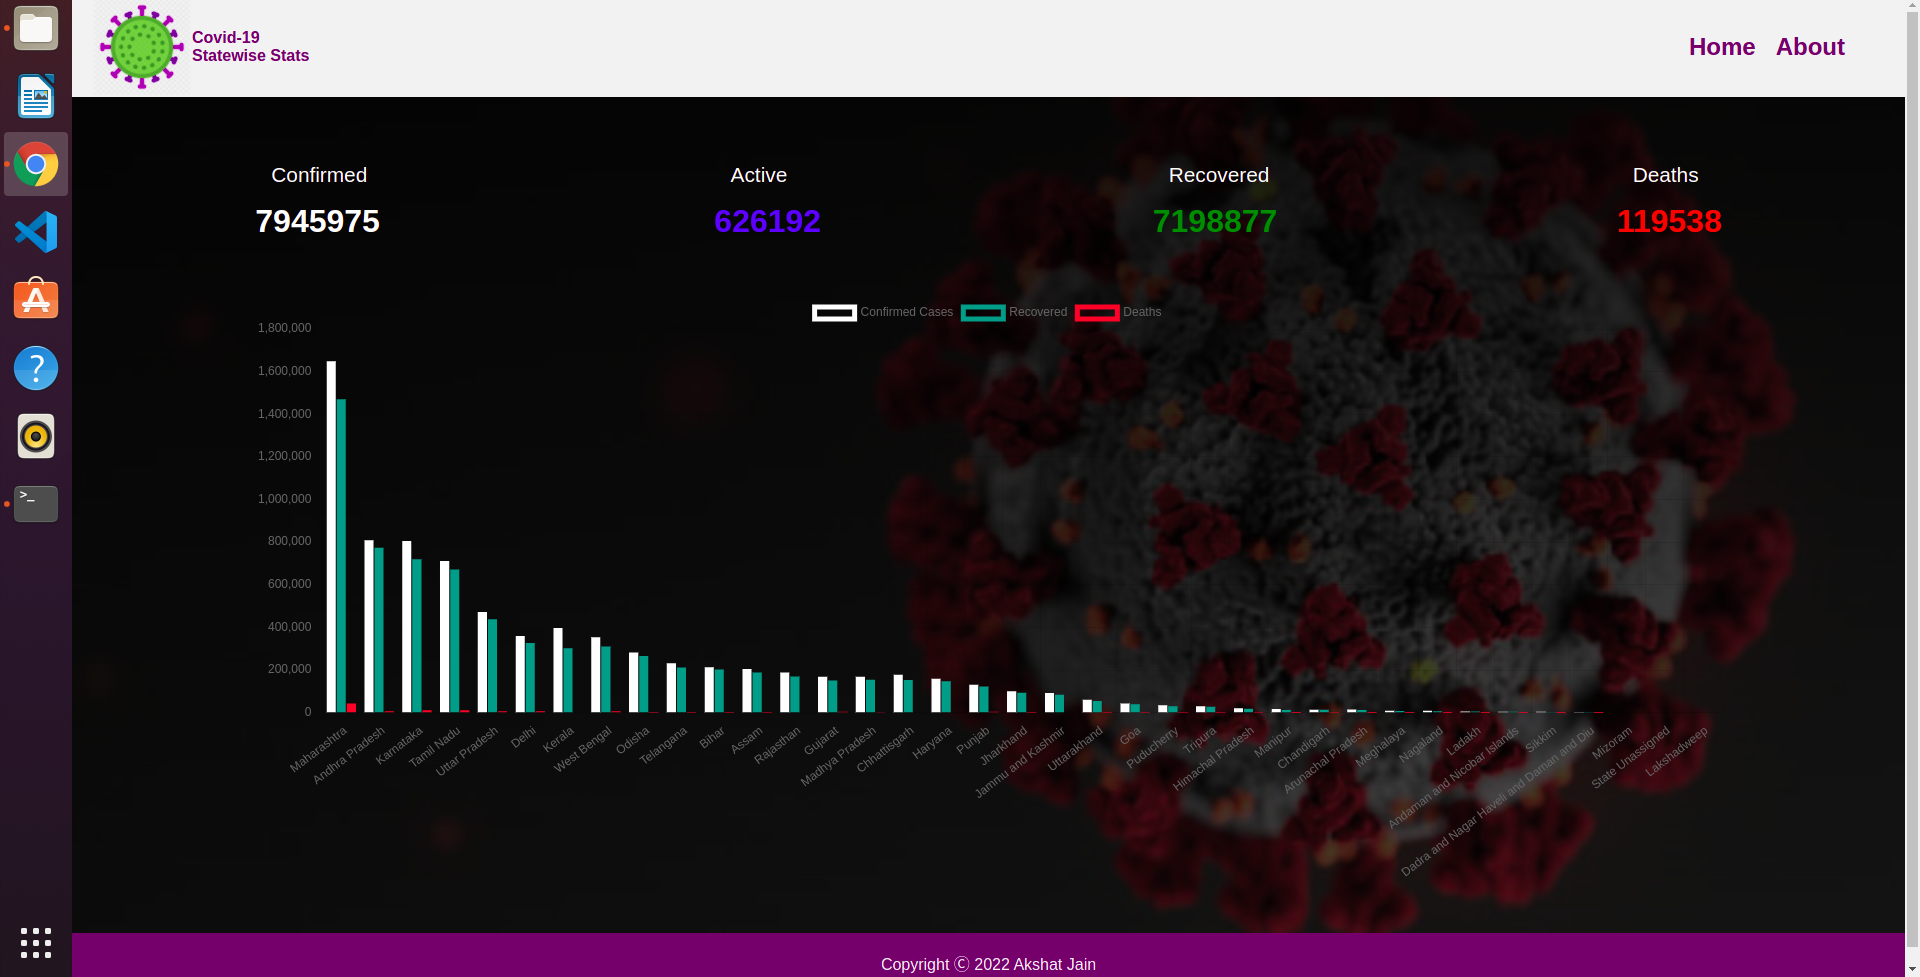
It shows recovered cases and deaths per states. For chart I have used chat.js labeled one dimension as states and another dimension as number of cases

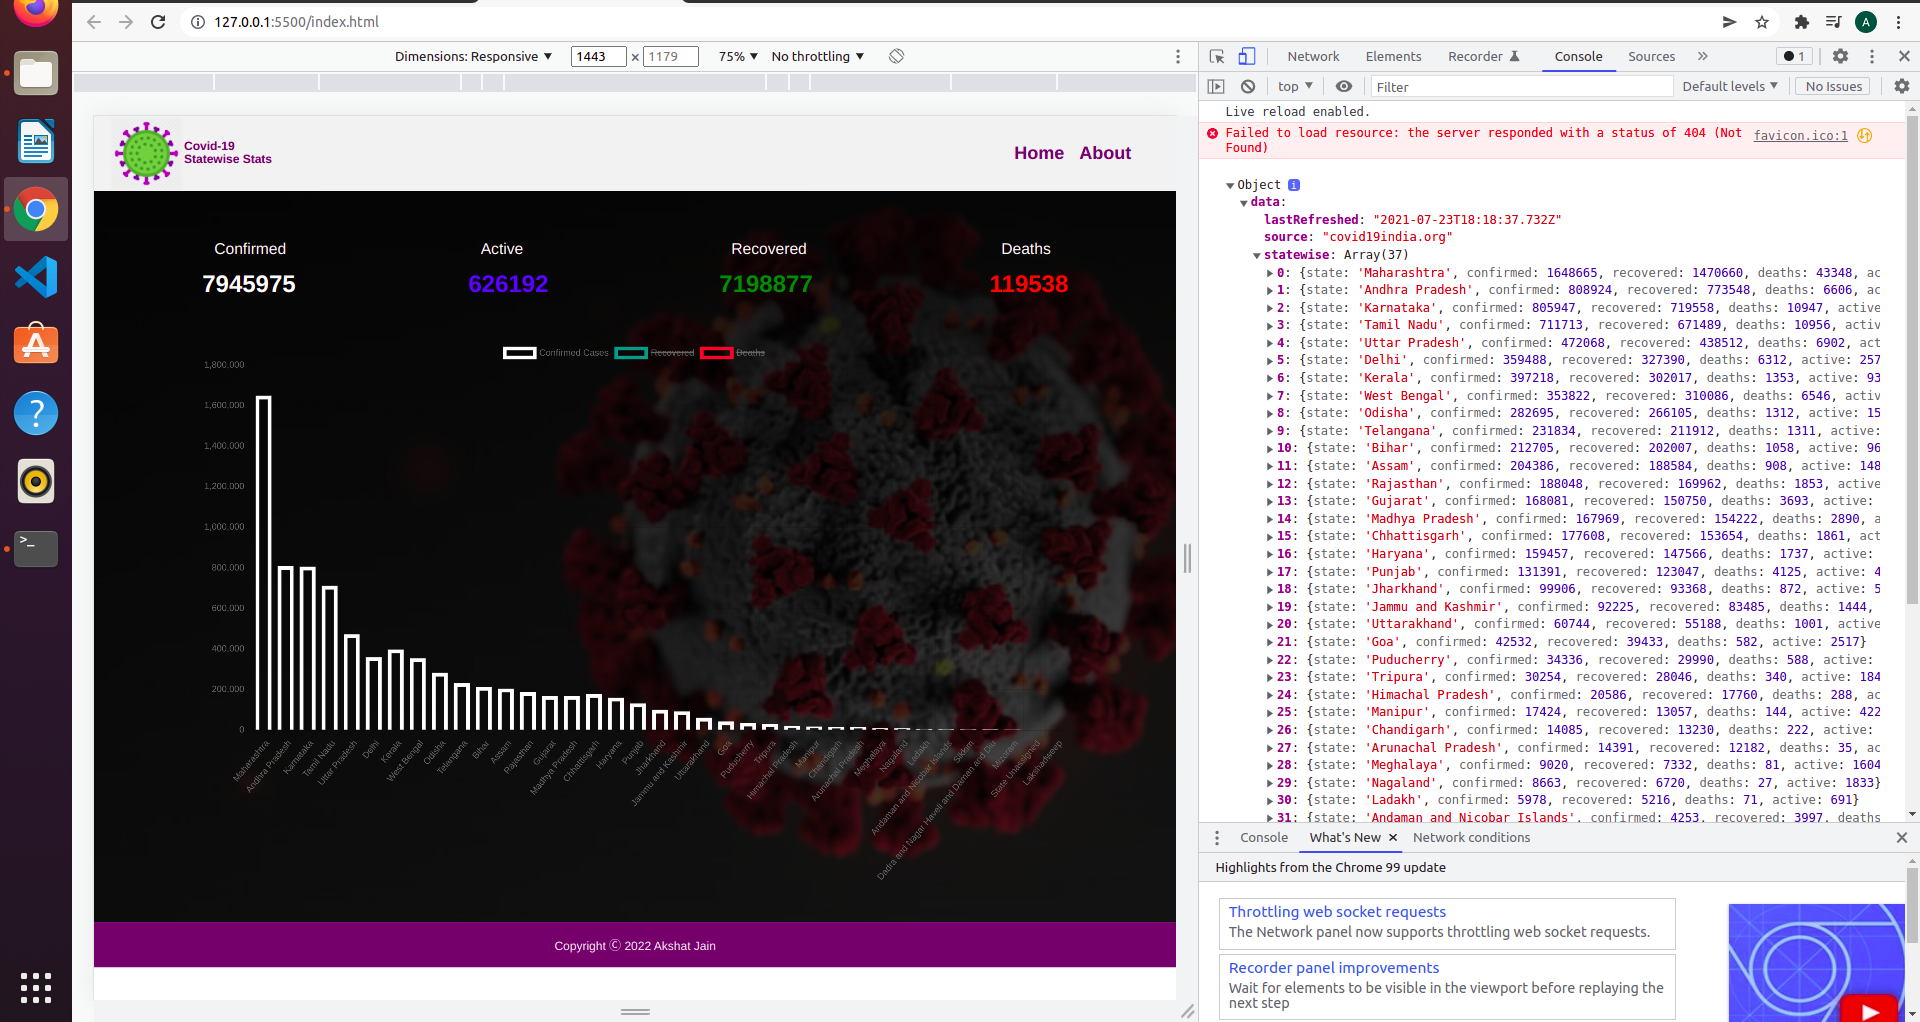
Data Came from a api got it from rapidapi but it shows data from march 2020 to october 2021

Screenshot from 2022-03-09 19-35-06

It is also fully responsive

Screenshot from 2022-03-09 19-37-31

In this I have learned how to apply chart.js library and how to fetch the data from a api

Thank You